 Facebook
 Twitter
 Pinterest
 Copy Link
How’s the Market? Q1 2024 Review of Seattle Area Real Estate
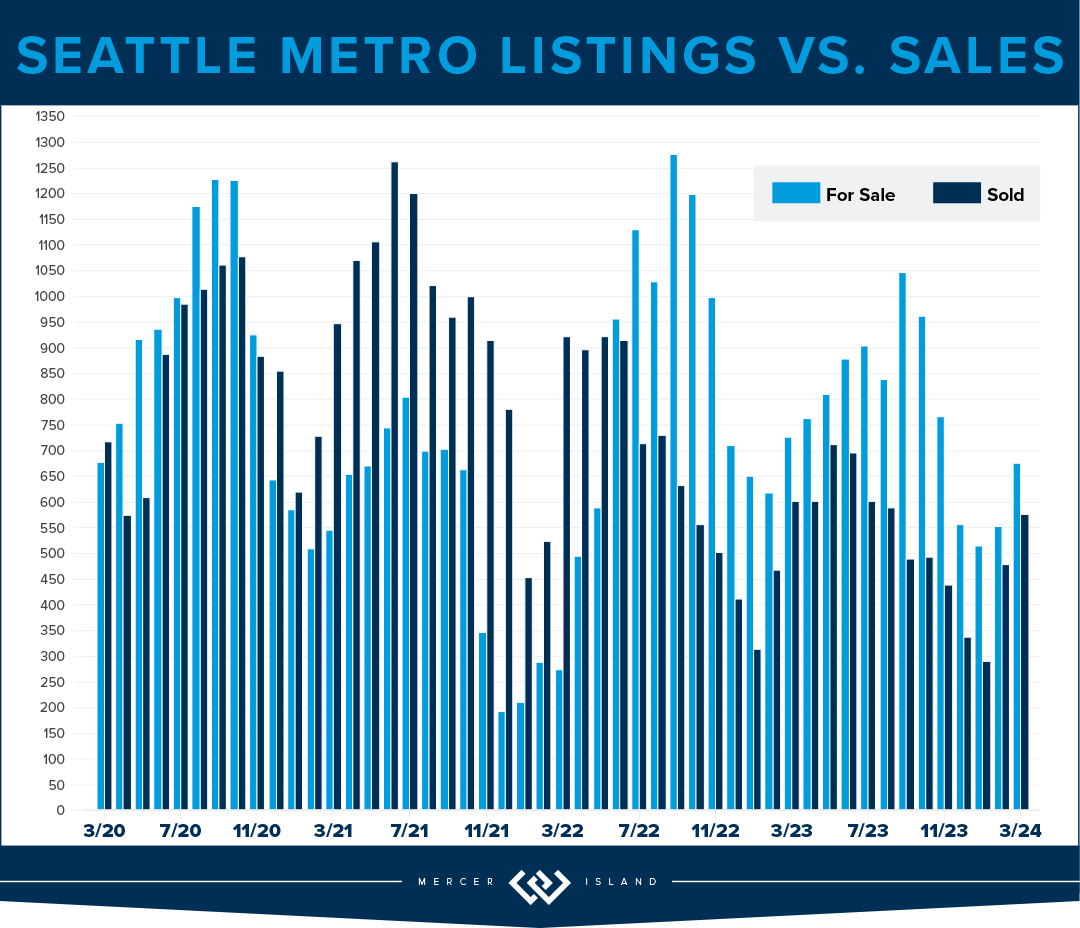
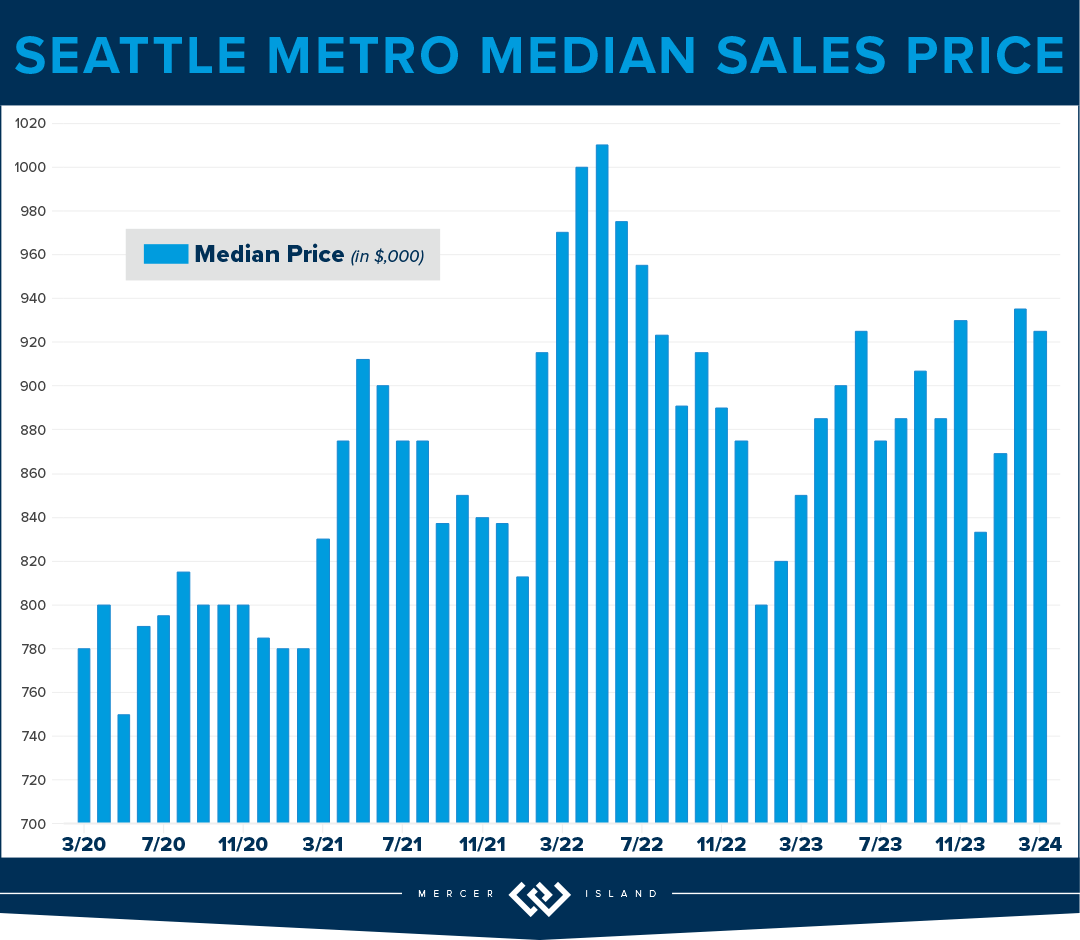
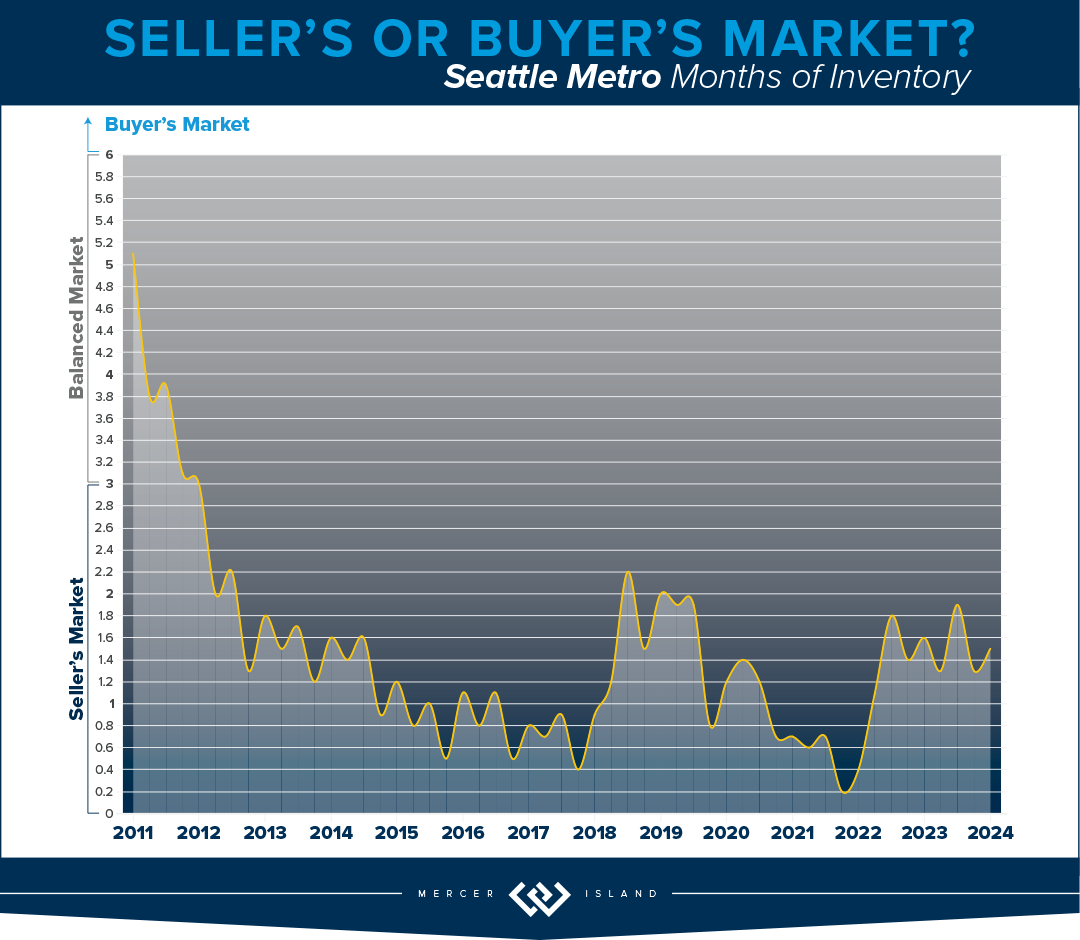
The Seattle/Eastside real estate market is hot and the Q1 stats support the claim; most homes sold in the first 10 days and either at or above their listed prices. Eastside median sales prices saw double-digit gains of 14% compared to this time last year, while Seattle was close behind with a 9% price bump. We saw more new listings this year than in Q1 of 2023; however, this was not enough to tip the scales and we remain staunchly in a seller’s market for the foreseeable future. The good news for buyers is that interest rates have stabilized and more sellers are jumping off the fence to list their homes. Competition for prime properties will remain high, however, so buyers should be prepared to take a leap of their own when the right home presents itself.
Click or scroll down to find your area report:
Seattle | Eastside | Mercer Island | Condos | Waterfront
SEATTLE
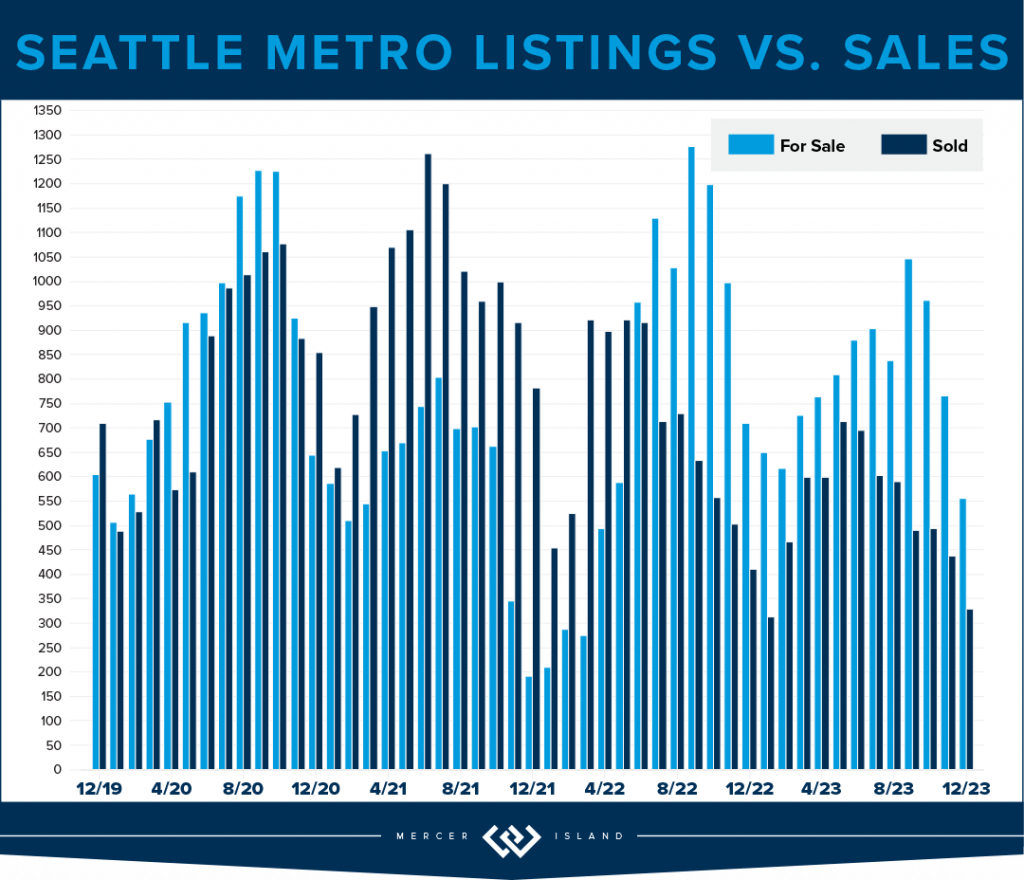
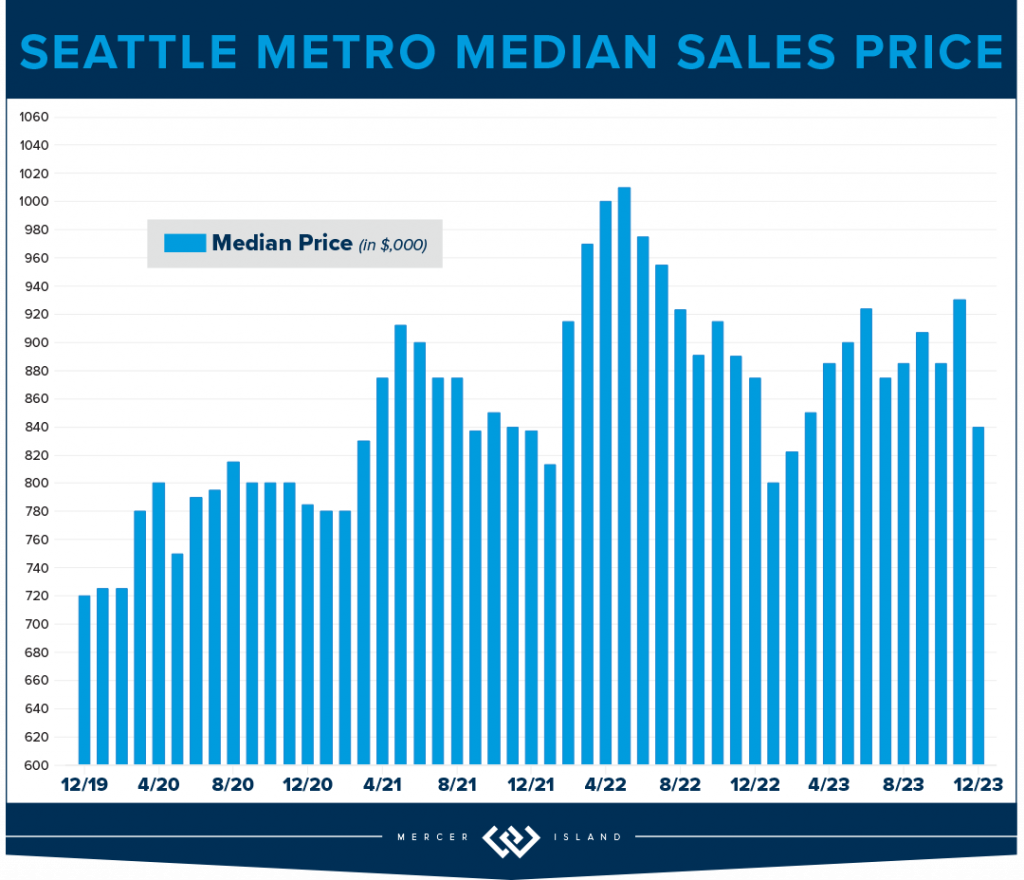
It’s safe to say the spring market hit early in Seattle! We’ve seen a 9% rise in median home price and 69% of listings selling at or above list price, all while interest rates are in the mid 6s. We are bullish on the year to come. Overall sales are down 3% YoY, which is slightly troubling because Q1 2023 saw a 28% dip from the previous year. If you dig a little deeper it seems that the north end (Kenmore and Lake Forest Park) saw a 42% reduction in overall sales with a 30% increase in median price.
Prices are up across the board. The largest jumps in median price are in Lake Forest Park and North Seattle (30% and 23% respectively), while the highest $/sq.ft. jumps were in Madison Park and South Seattle. 56% of all homes on the west side sold in the first 10 days and for an average of 105% of list price. This is a great indicator that the market will continue to be strong in Q2.
The total number of new listings remains relatively low in the city, when compared with years past. This is to be expected as current homeowners stay put to enjoy their cozy sub-3% interest rates. We hope that equity will begin burning holes in their pockets soon—the market could use the inventory. If you’ve been thinking about buying, this could be your year! Get pre-approved and be ready to jump when you see the right home come available.
If you’ve thought about selling your home, it may be a good year to do so. As is typical in the early stages of appreciating cycles, buyers are brought off the fence by “the house” popping up—and they’re paying premiums for cream puff properties. Interest rates have stabilized and experts say they may become even more favorable as the year progresses. Check with your agent about your own unique situation.
Click here for the full report and neighborhood-by-neighborhood statistics!
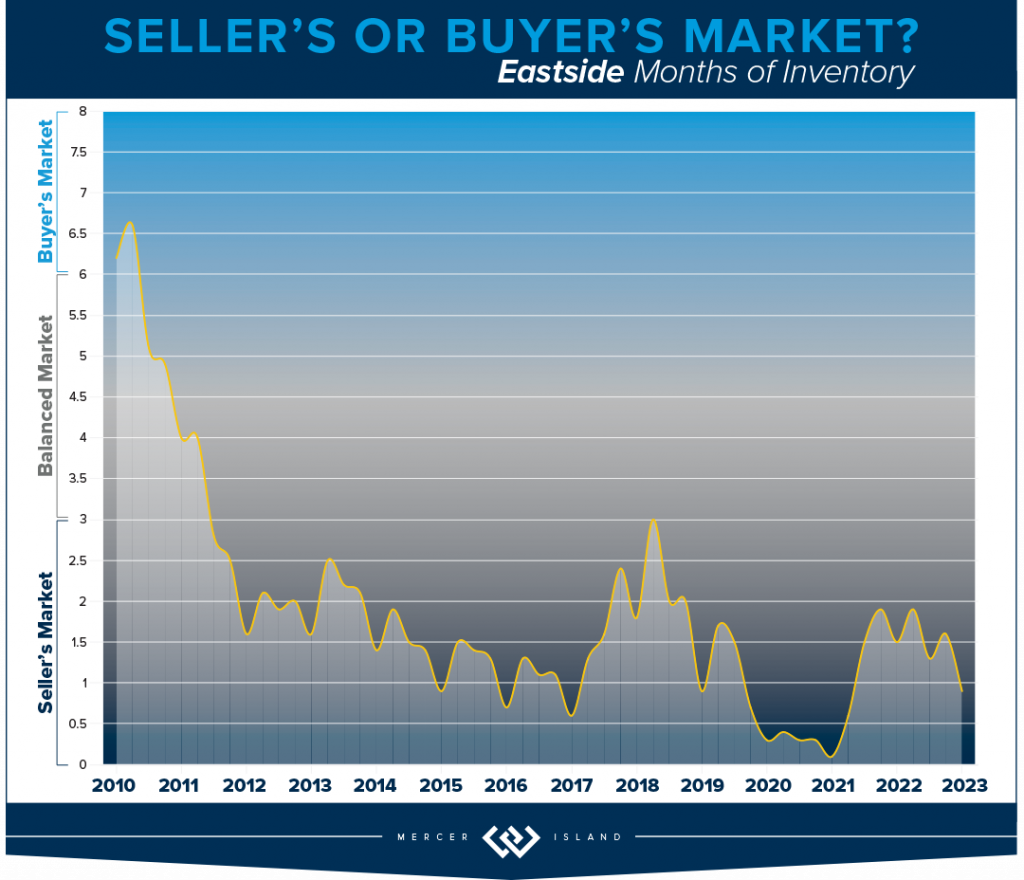
EASTSIDE
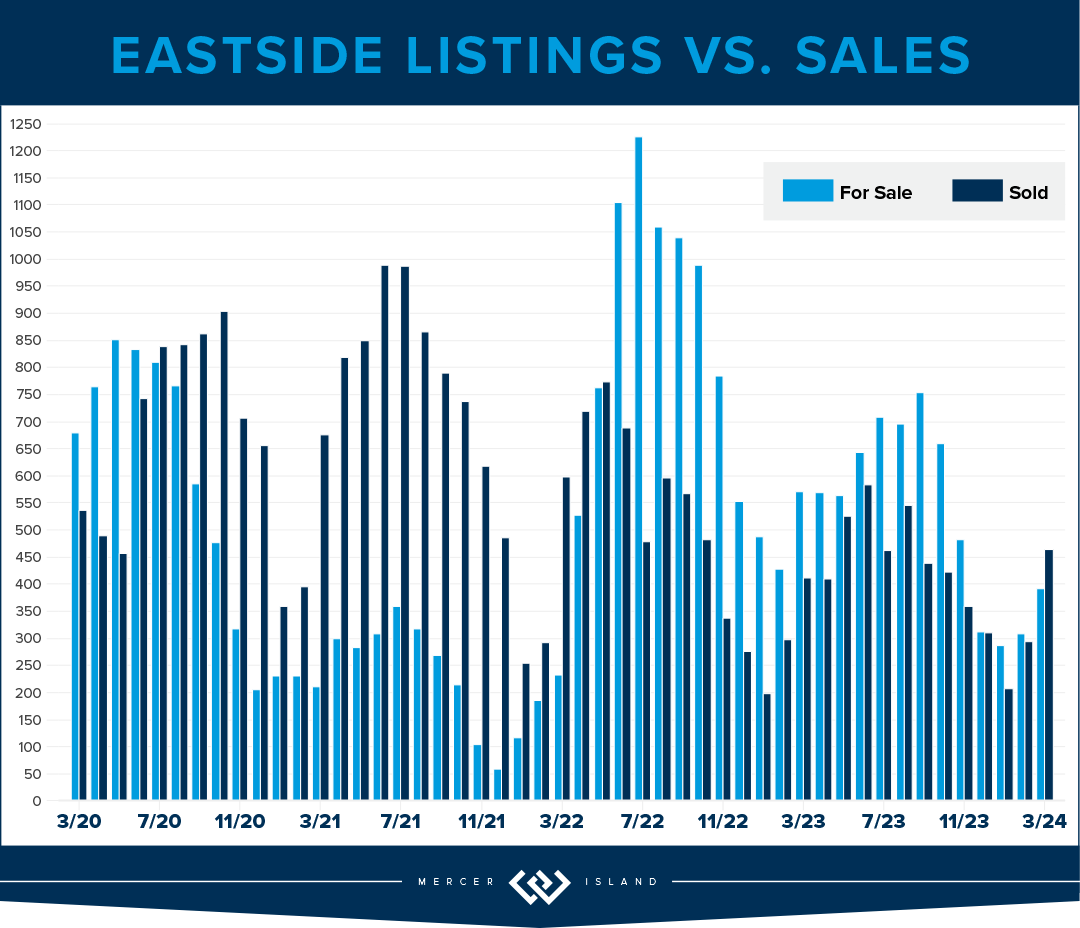
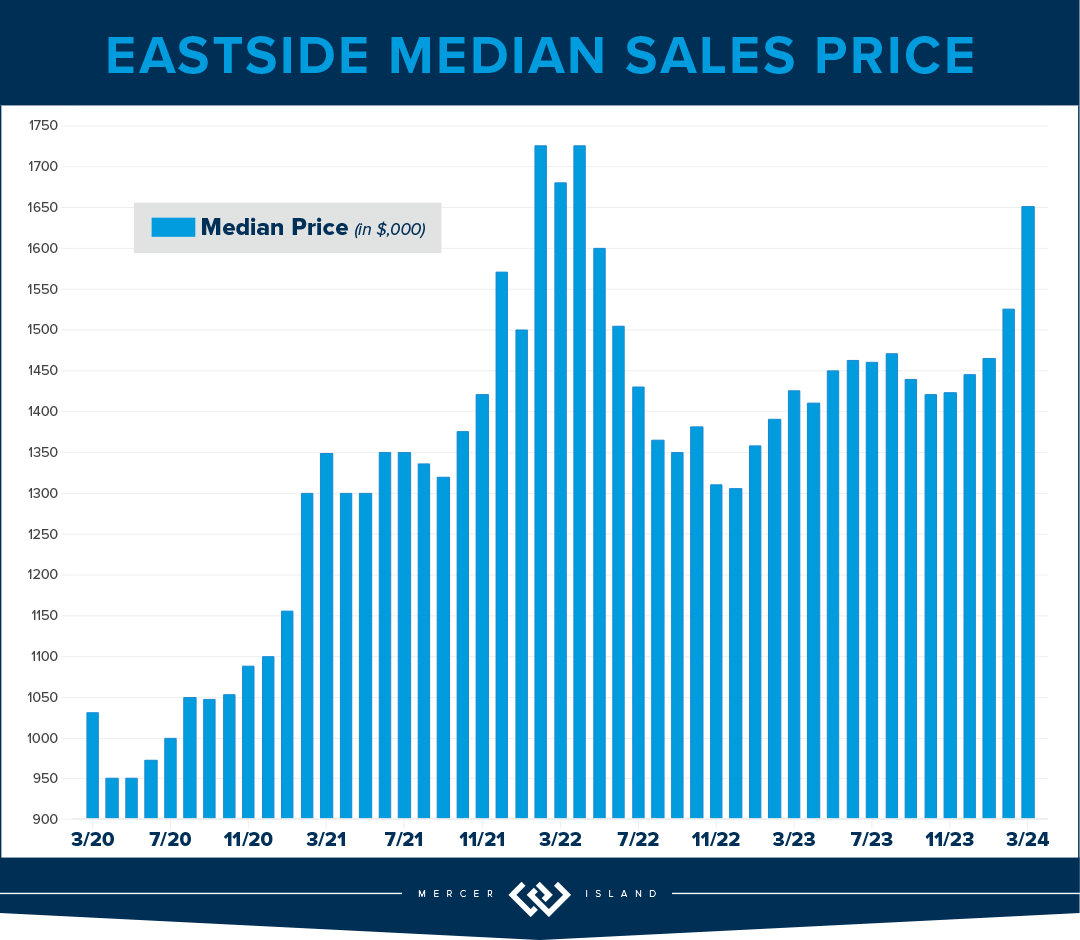
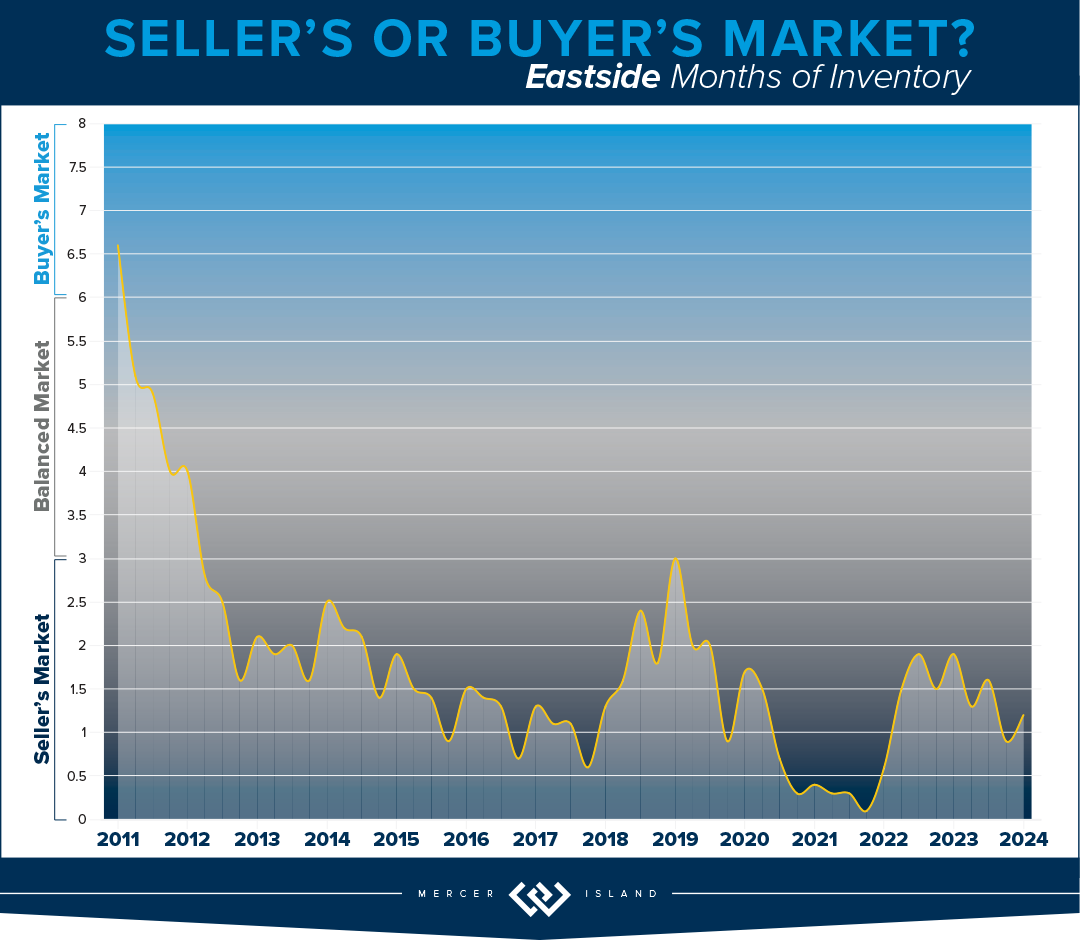
The numbers are in and the statistics reflect what agents and consumers have felt thus far in 2024—the market is hot. Median home prices on the greater Eastside are up 14%. 65% of all listed homes sold in the first ten days for an average of 105% of list price. The communities that have posted the largest gains are Kirkland and the area South of I-90 (32% and 21%). Redmond and West Bellevue reported much more conservative median price increases at 4%. The total number of pending homes was up 18% YoY, which bodes well for continued price gains.
If you’re in the market to purchase a home on the Eastside we are hopeful for more inventory this year. Even though rates are still nowhere near their all-time lows, which was the anecdotal explanation for lack of inventory in 2023, it seems that a Q1 sales boom is enough to help potential home sellers feel bullish on 2024. This means you can also expect competition for the prime properties. Our best home buying advice: do your research, act with confidence, and remember real estate is a long-term investment.
If you’re a homeowner thinking about a home sale in 2024, Q2 could be the perfect time. Shoppers are out in droves and they’re prepared to pay top dollar for quality product. The steep jump in median home price should continue at least into Q2. The only threat in Q3 and Q4 is what could shape up to be a distracting election cycle. Though, the election year is likely what is keeping downward pressure on rates. Our best home selling advice: follow your agents’ guidance on timing as it’s sure to be a volatile year. Prep hard and price conservatively. It will all work out in your favor.
Click here for the full report and neighborhood-by-neighborhood statistics!

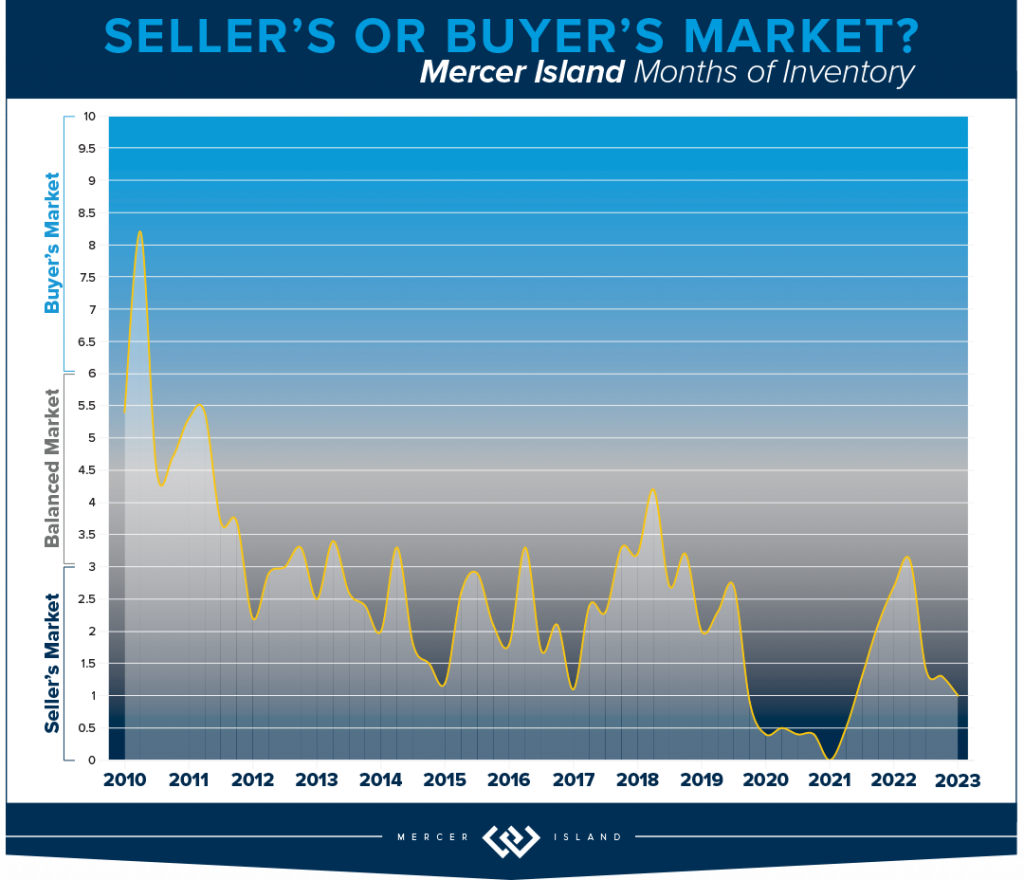
MERCER ISLAND
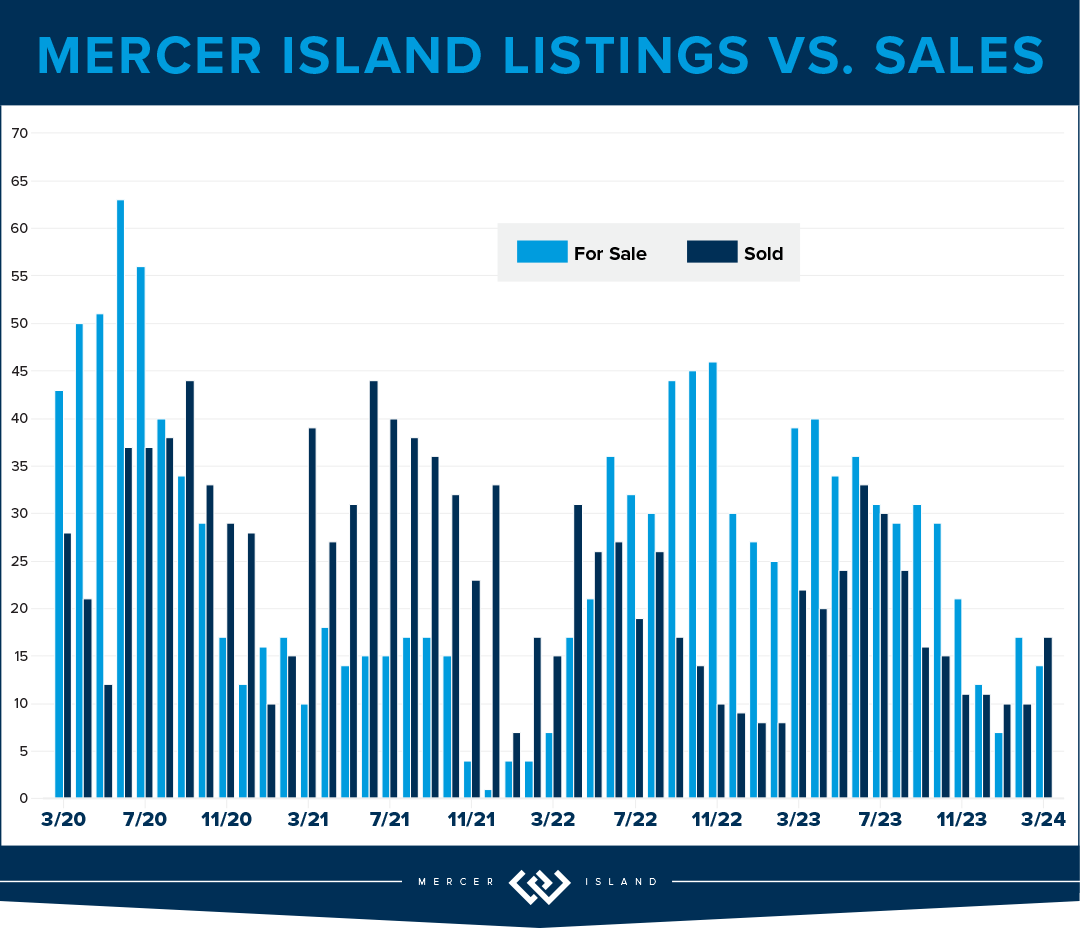
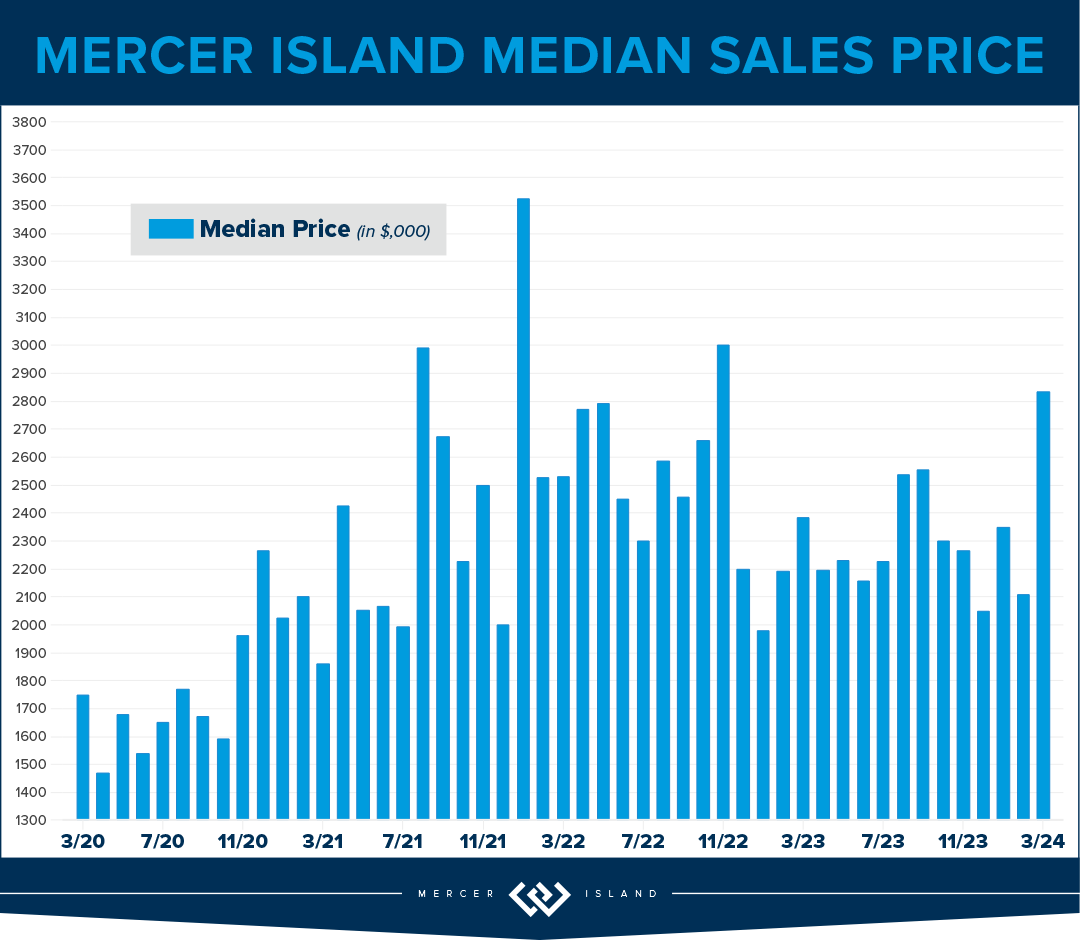
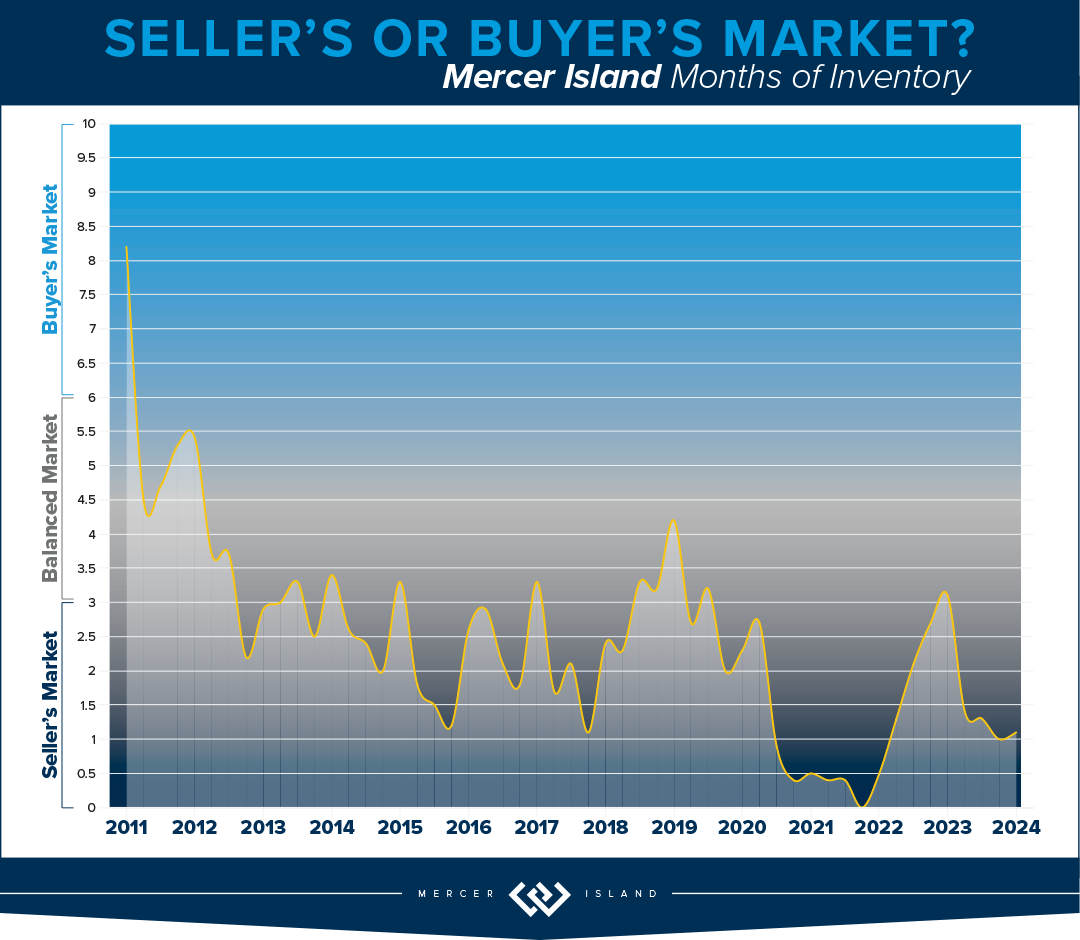
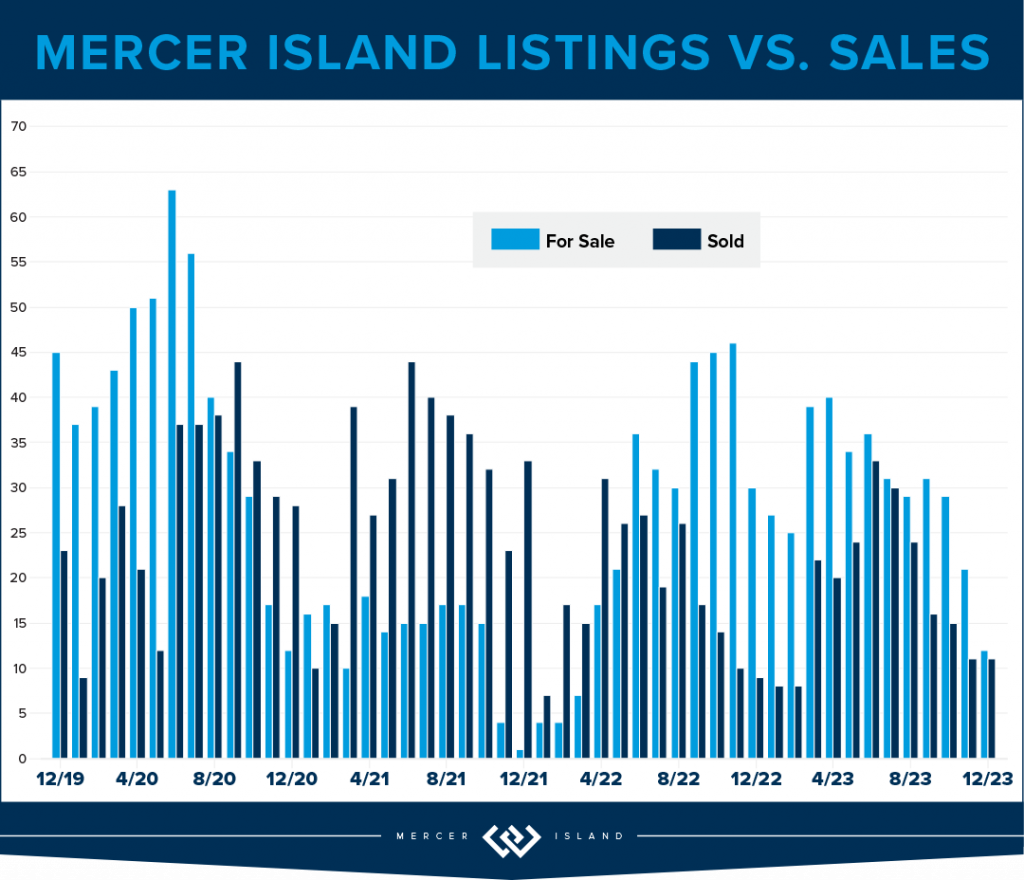
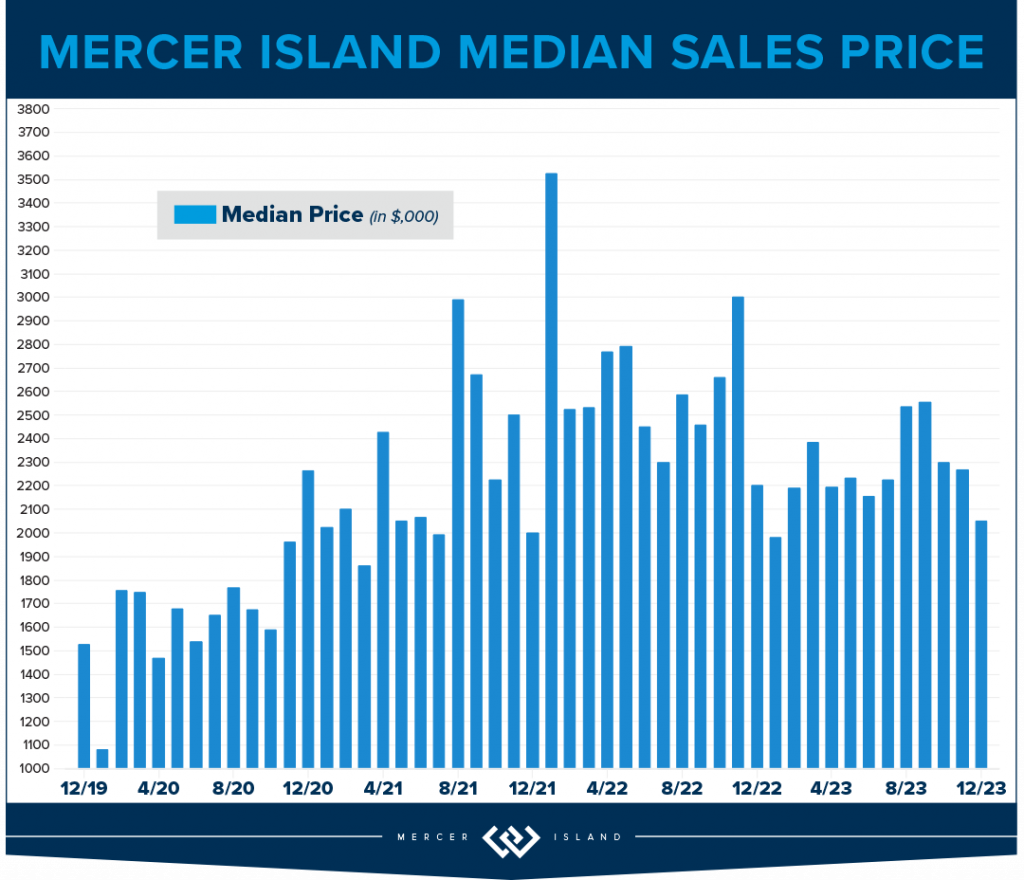
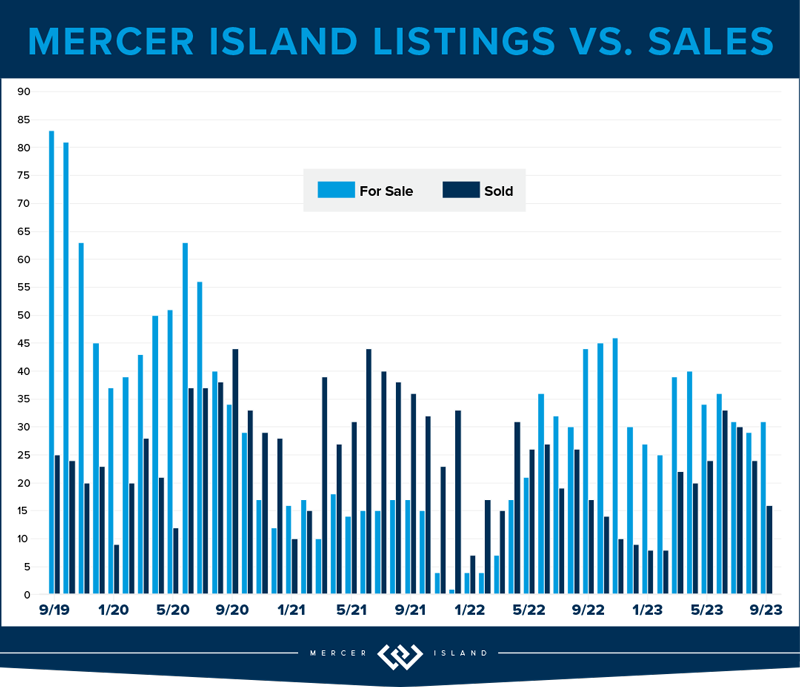
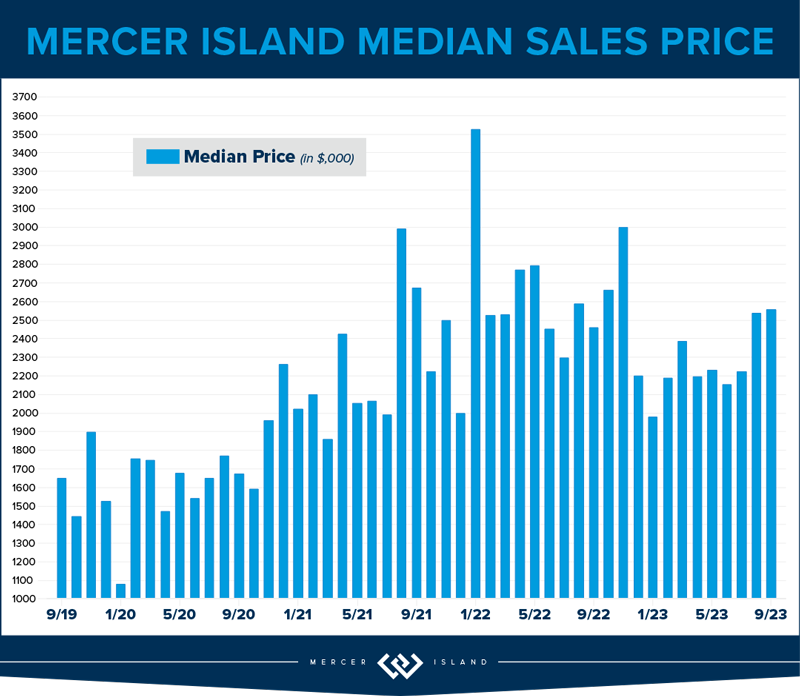
What a difference a year makes! In Q1, Mercer Island’s median sale price is already up 13% over a relatively flat year in 2023, rising from around $2,200,000 to $2,520,000. We’re seeing shorter market times and multiple offers; spring has sprung on the Island. With 59 new listings and 37 closed sales inventory appears to be tracking with what we’ve seen in Q1 in years past. That said, condos continue to lag behind single family: only 6 closed sales all quarter. The average price per square foot is $535—about where it’s been tracking since it jumped from $485 in Q1 of 2021. Not a lot of shocking change here.
If you’re in the market to purchase a home on Mercer Island you can expect better inventory this year than last year. Even though rates are still nowhere near their all-time lows, which was the anecdotal explanation for low inventory in 2023, it seems that a Q1 sales boom is enough to help potential home sellers feel bullish on 2024. This means you can also expect competition for the prime properties. Our advice: do your research, act with confidence, and remember real estate is a long-term investment.
If you’ve been thinking about selling your home to upgrade or downsize, Q2 could be the perfect time. Shoppers are out in droves and they’re prepared to pay top dollar for quality product. The steep jump in median home price should continue at least into Q2. The only threat in Q3 and Q4 is what could shape up to be a distracting election cycle. That being said, the election year is likely what is keeping downward pressure on rates. Our advice: follow your agents’ guidance on timing as the situation develops this year. Prep hard and price conservatively. It will all work out in your favor.
Click here for the full report and neighborhood-by-neighborhood statistics!
CONDOS – SEATTLE & EASTSIDE
It seems a healthy start to 2024 in the condo market. While the Q1 of 2023 numbers were down across the board, Q1 of 2024 is looking up with a combined rise in price of 15% and 34% more fresh new listings (YoY).
On the Eastside there were 202 active listings available at the end of the quarter, while 501 homes accepted offers during the quarter. This was the highest number of pendings in one quarter in the last two years! To real estate professionals, “pendings” are the canary in the coal mine of the market. A spike in pendings is a predictor that the market is heating up.
In Seattle new listings doubled from Q4 2023 (534) to Q1 2024 (1019), while pendings and solds are up 20% YoY. If you’re shopping for a condo, keep an eye out for enticing new inventory in Q2. 42% of Seattle condos sold in the first 10 days and for 100% of the list price. 44% of condos took more than 30 days to sell, though they still commanded 97% of their list price. To me this means that pricing is more important than ever in determining your outcome.
Now it’s time for me to stand on the home ownership soap box. There seem to be a lot of headlines about the unaffordability of single family homes. While there is no denying how expensive it is, there is a missing piece to the story: at some point during the prolonged period of “cheap money” first time buyers forgot about the first rung of the property ladder. CONDOS create an affordable option to start building wealth at a younger age. It’s an important real estate product that has been overlooked. We are hopeful that enterprising young homeowners return to the condo market in droves this next real estate cycle.
Check out area-by-area details the full condo report.
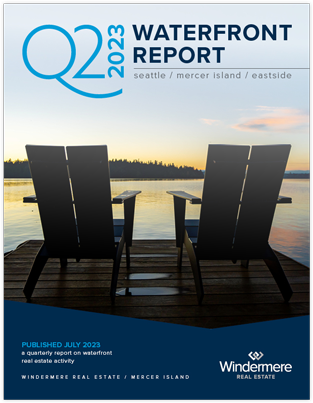
WATERFRONT
Seattle and the Eastside each had 6 waterfront sales in the first quarter, with 4 out of the 6 sales for both areas closing at or above the listing price (including one unlisted sale). All of the Eastside’s listed sales were on the market for only 8 days or less. Lake Sammamish was close behind with 5 sales (however 4 out 5 sales went below the asking price) and Mercer Island lagged behind with just 1 sale. Medina boasted the largest waterfront sale, a newer home on 117 feet of lakefront with a mind-blowing 13,590 interior square feet and 1.5 acres of grounds. The most modest sale was for a Lake Forest Park home on just 40 feet of waterfront—it sold almost immediately for 7% above its asking price.
This brief overview of the entire Seattle-Eastside private waterfront market, including Mercer Island and Lake Sammamish, illustrates the trends occurring in our region over time. This data is interesting and insightful but cannot replace an in-depth waterfront analysis with your trusted professional.

We earn the trust and loyalty of our brokers and clients by doing real estate exceptionally well. The leader in our market, we deliver client-focused service in an authentic, collaborative, and transparent manner and with the unmatched knowledge and expertise that comes from decades of experience.
2737 77th Ave SE, Mercer Island, WA 98040 | (206) 232-0446
mercerisland@windermere.com
© Copyright 2024, Windermere Real Estate/Mercer Island. Information and statistics derived from Northwest Multiple Listing Service and Trendgraphix, and deemed accurate but not guaranteed. Seattle cover photo courtesy of Brooke Davis and Emerald City Snap. Eastside cover photo courtesy of Team RAREnorthwest and Clarity Northwest Photography. Mercer Island cover photo courtesy of Nancy LaVallee and Clarity Northwest Photography. Condo cover photo courtesy of Michael Fleming and Clarity Northwest Photography.
How’s the Market? An Annual Review of Seattle Area Real Estate

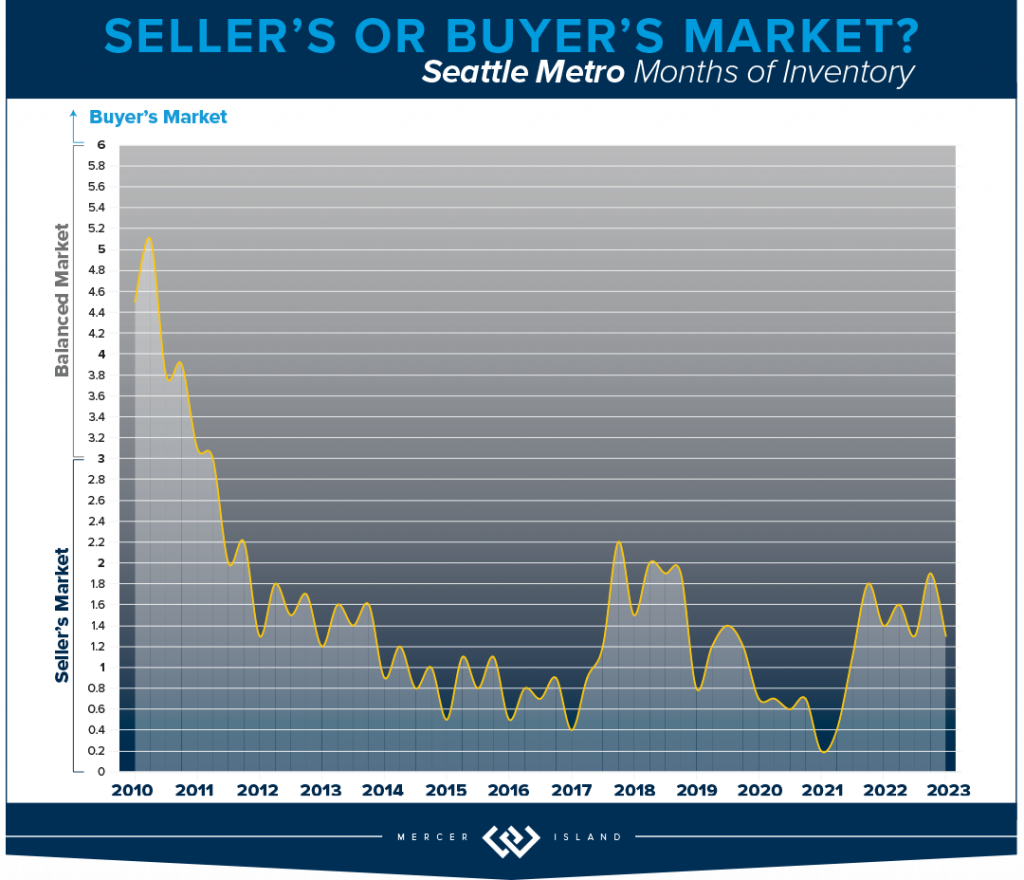
Median home sales prices across the region saw a year-over-year dip compared to 2022, with prices settling just above their 2021 levels. That being said, most homes still sold within the first 10 days on the market and either at or above the listing price. Today’s higher rates, in concert with constricted inventory, have slowed the total number of sales. Should rates ease like experts are predicting, however, we will see more people enter the market and hopefully more listings will follow. (Read more about that in our full 2024 forecast).
Click or scroll down to find your area report:
Seattle | Eastside | Mercer Island | Condos | Waterfront
SEATTLE
Would you like the good news or the bad news? Bad: Overall home prices slid in the city by 7%. Good: 57% of all homes sold in the first 10 days and for 104% of list price. While we may have backed off of our head spinning pandemic list/sale percentages, we’re still going strong. To us what this means is: if you’re considering selling there is probably a buyer ready and waiting to make you an offer. It just won’t be quite as lucrative as it might have been in 2022. It could be a lot worse given the high cost of money in 2023. Homeowners certainly came out ahead and Seattleites have our chronically low inventory and stable job market to thank for this!
We finished the year with sales down 23%, a figure made a lot less scary by the fact that listings were also down city wide by 24%. North Seattle east of I-5 saw the most stable prices, only losing 2% at a median price of $976,000. Queen Anne/Magnolia lost 10%, closing out the year at $1,263,000. It’s also interesting to note that 65% of homes sold for list price or better. This means we have mostly well counseled homeowners with reasonable expectations of what the market will bear.
If you’re in the market for a new home in 2024, Q1 is a great time! Inventory hasn’t been this low since 2012. If the cost of money goes down—as many experts are predicting—and more people decide to purchase, it could get very competitive very quickly! Beat the rush!
Click here for the full report and neighborhood-by-neighborhood statistics!
EASTSIDE
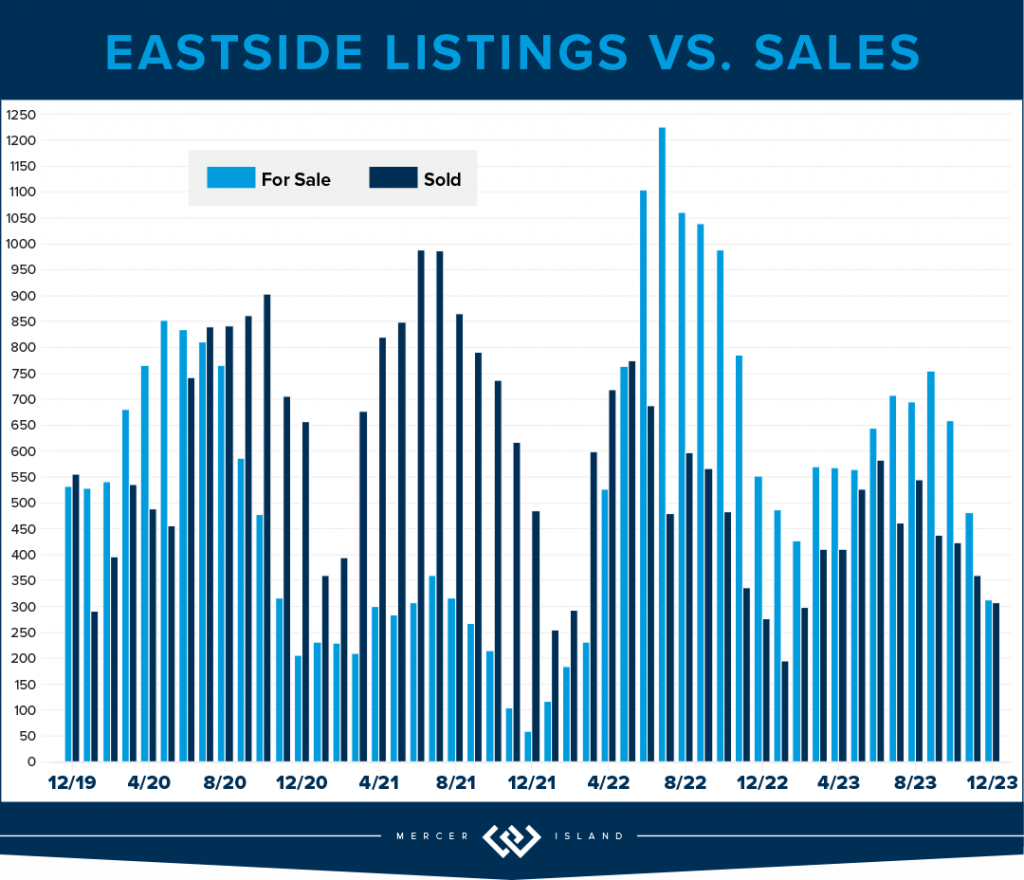
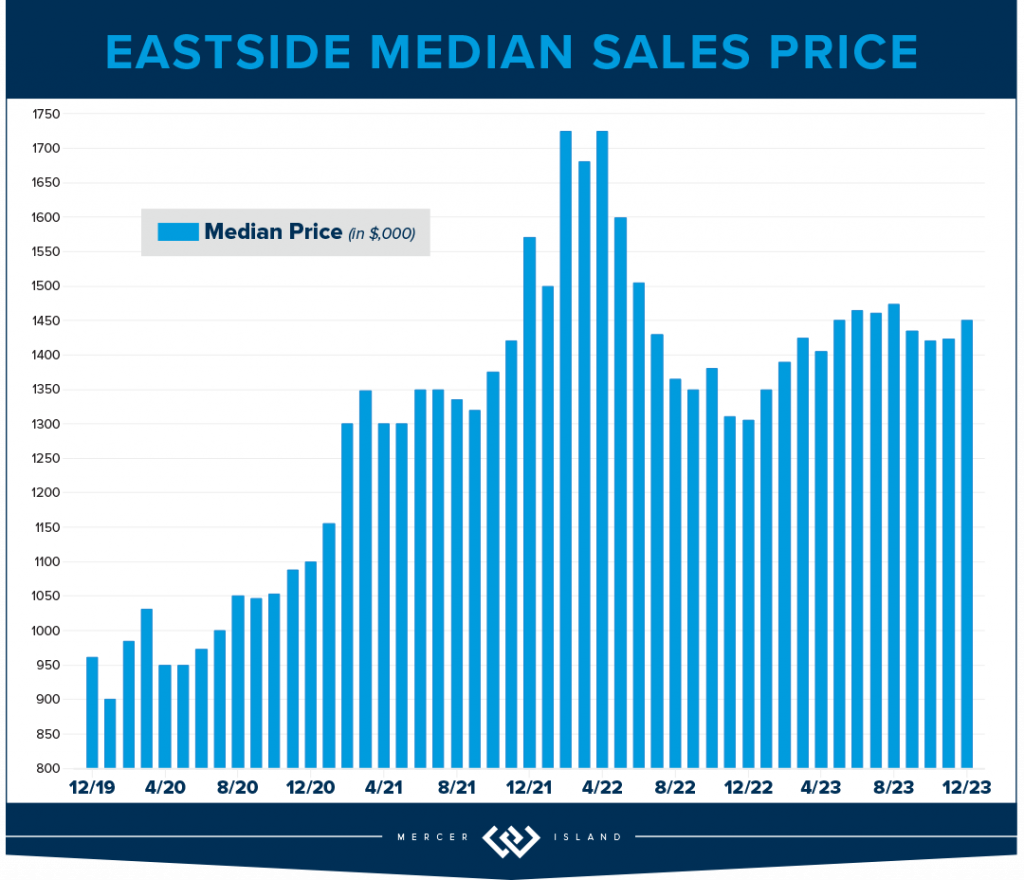
The Eastside median sales price was down by 4% as we closed out 2023. This is in large part due to the interest rates. It certainly isn’t supply and demand: Total listings were down 29% while sales only dipped 18% YOY. That’s staggering. Buyers and Sellers did not seem to be aligned in their estimation of the market: only 55% of homes sold for at or above list price while 45% needed a reduction or negotiation prior to accepting an offer. While this sounds balanced, it’s out of the norm compared to our historic data.
Sammamish was the strongest overall area with a whopping 1217 sales (25% of the total 4954) and the lowest median price dip of 3%; $1,400,000 in 2023 v. $1,450,000 in 2022. Mercer Island was the hardest hit with a 12% drop in median price to $2,239,000—the lowest since 2020. Corrections are healthy for the long-term health of a real estate market. We’re not sure how long this one will last; all signs are pointing to continued low inventory. It seems to be a game of chicken with the interest rates that could lead to massive pent-up demand.
If you’re in the market for a new home in 2024, Q1 is a great time! Inventory is at its absolute 15 year low (6,140 listings compared to a high of 10,880 in 2010) which means we are poised for a market flip. If the cost of money goes down—as many experts are predicting—and more people decide to purchase, it could get very competitive very quickly! Beat the rush!
Click here for the full report and neighborhood-by-neighborhood statistics!
MERCER ISLAND
The Island saw just 289 new listings last year, only 60% of the peak 488 in 2013. There are some numbers that show we had very realistic homeowners in 2023: a 78% absorption of listings, (222 sales, up from 218 in 2022) and 98% list/sale price. When buyer and seller expectations meet, magic happens. The median price in 2023 was $2,239,000 back to around the same level as 2021—if you remember, this was a 30% increase from $1,700,000 in 2020.
Condos on the Island are off 8% to $620,000 from the 2022 high of $674,000, this is a strong showing. For the previous 4 years (2018-21) median prices were in the $500’s. There were only 33 sales Island-wide, the lowest number of total sales in 15 years. Listings were down as well: the lowest level since 2012. The metrics show that the market was strong, even with the dip in median sales price: 19 days on market, 99% list/sale price ratio, on average only 4 listings were active at one time. These are all signs of a constricted inventory/sellers’ market, which is what will eventually drive prices higher.
All in all, MI is holding strong to the price gains made during the pandemic. We are bullish on our market in 2024 as interest rates are easing. Time will tell.
Click here for the full report and neighborhood-by-neighborhood statistics!
CONDOS – SEATTLE & EASTSIDE
Whew! What a year! The major condo headline for both Eastside and Seattle condos: Prices hold steady while demand dips 25%! While this is sensationalized, it’s true. Likely due to the fact that inventory was also down by 20%, which means that supply and demand remained aligned and shielded homeowners from what could have been a massive hit to their bottom lines.
On the Eastside, when the dust settled, prices are down by 1%. The largest drop in median price was East Bellevue losing 11% while Kirkland soared above all other neighborhoods with double digit gains (up 19%). Other areas of note: West Bellevue topped the charts with a median sale price of $880,000! This is higher than the $876,000 residential median sale price in the city of Seattle.
Speaking of Seattle, the condo market in the city reminds us of The Little Engine That Could. Chugging merrily along despite having the odds stacked against it: I think I can! Overall, the city posted a 5% gain year over year with record high median sales price of $546,000. Downtown saw the highest overall unit volume at 439 total sales, while Greenlake/Ballard boasted the highest overall gain in median price at 15% appreciation. All good news, finally.
Check out area-by-area details the full condo report.
WATERFRONT
While Seattle and the Eastside both posted fewer waterfront sales in 2023 than in 2022, Lake Sammamish saw a big 40% year-over-year jump in sales. Mercer Island’s sales increased by a more modest 10%.
The highest waterfront sale of 2023 was $20 million for a breathtaking Evergreen Point estate on 115 feet of prime low-bank shoreline. Listed by Windermere and truly unique with a custom home designed by Hal Levitt, it sold its first day on the market (and well above the $18.5m asking price!).
The most modest waterfront sale was a 1,749 sq. ft. Lake Sammamish home sold by the owner for $1.62 million. It featured 25 feet of lakefront and big lake/mountain views.
Click here for the full waterfront report with top sales for the entire Seattle-Eastside private waterfront market, including Mercer Island and Lake Sammamish. The data is interesting and insightful (but cannot replace an in-depth waterfront analysis with your trusted professional).
We earn the trust and loyalty of our brokers and clients by doing real estate exceptionally well. The leader in our market, we deliver client-focused service in an authentic, collaborative, and transparent manner and with the unmatched knowledge and expertise that comes from decades of experience.
© Copyright 2024, Windermere Real Estate/Mercer Island. Information and statistics derived from Northwest Multiple Listing Service and Trendgraphix, and deemed accurate but not guaranteed. Seattle cover photo courtesy of Team RAREnorthwest and Baylee Reinert with Clarity NW Photography. Eastside cover photo courtesy of Donna Cowles and Kelly Morrissey with Clarity NW Photography. Mercer Island cover photo courtesy of the Oordt Ceteznik Realty Group and Clarity NW Photography. Condo cover photo courtesy of Fred Fox and Brandon Larson with Clarity NW Photography. Waterfront cover photo courtesy of Anni Zilz and Andrew Webb with Clarity NW Photography.
2023 Holiday Happenings Around the Sound
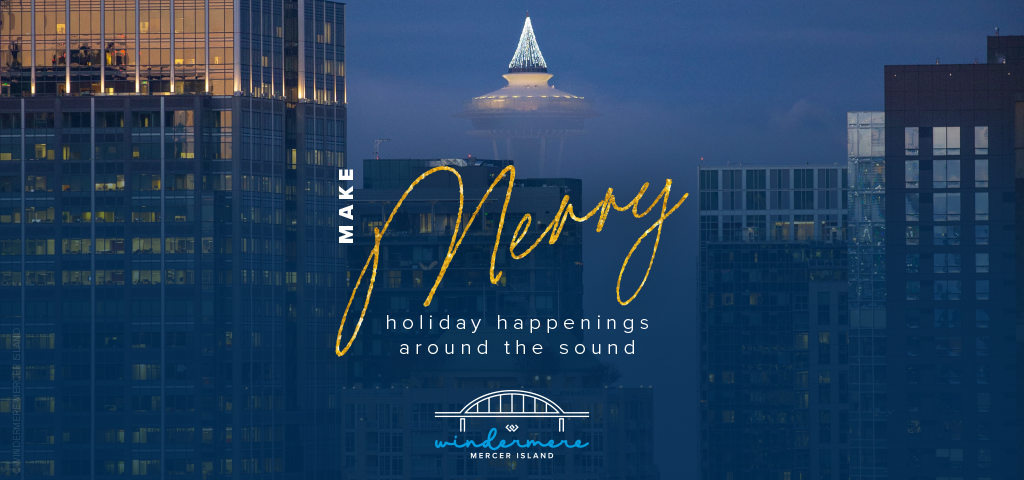
The rain is back, the days are dark…who is ready to beat the gloom? Below are some Seattle-area favorites to brighten your spirits. You can bundle up and bask in breathtaking outdoor light shows, or relax and enjoy from the comfort of a cruise ship or theater seat…
Winterfest at Seattle Center
305 Harrison Street, Seattle, WA 98109
www.seattlecenter.com/winterfest
- Dates/Times: Nov. 24, 2023 – Dec. 31, 2023. Seattle Center (Holiday lighting Nov. 1 – March 1); ice sculpting Nov. 24, 12-4 pm; Winter train & village open daily Nov. 24 – Dec. 31 | 10 am – 6 pm; Seattle Christmas Market open Nov. 24 – Dec. 24.
- Cost: General admission is free for all ages; Seattle Christmas Market is $16-$20 for adults (buy tickets)
- Parking: Paid parking available at the Mercer Garage, 5th Ave N Garage, and Theatre Commons ADA Lot. Click here for the campus map.
- Food: A multitude of dining options await you in the Armory.
- Special Events: Opening Day Celebration, live stage entertainment at the Armory, the Winter Train & Village, New Year’s Eve Celebration Dec. 31 from 8pm-12 Midnight, and more!
- Holiday Closure: Dec. 25

Image courtesy of seattlecenter.com
The Nutcracker by Pacific Northwest Ballet
McCaw Hall | 321 Mercer St, Seattle
pnb.org/nutcracker/
click here to get tickets
- Dates: November 24 – December 27, 2023
- Cost: $29-$208 per seat
- Parking: Mercer Street Garage or Other Nearby Parking
- Food: Beverages and snacks are available for purchase

Image courtesy of pnb.org
Garden d’Lights at Bellevue Botanical Garden
12001 Main Street, Bellevue WA 98005
http://gardendlights.org
click here to get tickets (must be purchased online)
- Dates/Times: Open nightly Nov. 25, 2023 – Dec. 31, 2023 | 4:30 – 9:00 pm
- Cost: $8 per person (ages 10 and under are free)
- Promotions: Discounted$5 ticket nights Nov. 27-30 and Dec. 4-7.
- Parking: Premium parking is $5 per car in the Garden’s lot as space allows OR park for free at Wilburton Hill Park
- Food: Hot drinks and snacks are available for purchase
- Holiday Closures: December 25

Image courtesy of bellevuebotanical.org
Snowflake Lane at the Bellevue Collection
Bellevue Way & NE 8th Street, Bellevue WA 98004
http://snowflakelane.com/
- Dates/Times: Nightly Nov. 24, 2023 – Dec. 24, 2023 | 20 minute show starts at 7 pm
- Cost: Free for all ages
- Parking: Free parking at Bellevue Square, Bellevue Place and Lincoln Square
- Food: A variety of dining options (from happy hour, to kid fare, to gourmet) are all within walking distance
- Special Events & Activities: Ice Skating, Santa Photos
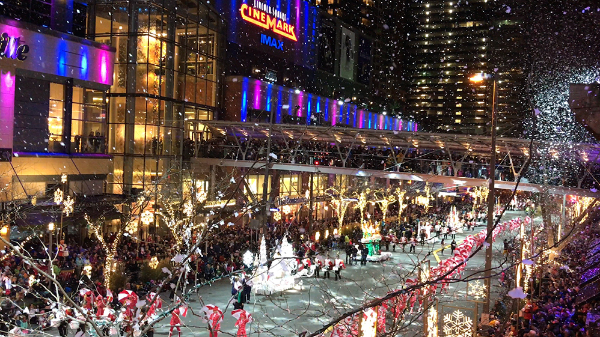
Image courtesy of snowflakelane.com
Christmas Ship Festival
Launch locations include Seattle Waterfront – Pier 55, Shilshole Bay Marina, Hyatt Regency Lake Washington, Lake Union Park (MOHAI), AGC Marina, Carillon Point Marina, and Kirkland City Dock.
www.argosycruises.com
click here to get tickets
- Dates/Times: Click here for the full schedule
- Cost: $40 – $74 per person (kids 3 and under are free)
- Parking: Varies by location – click here for details
- Food: Snacks and drinks available for purchase on the ship. Outside food/drinks are not allowed.
- Special Events: Opening Night, Parade of Boats, Grand Finale
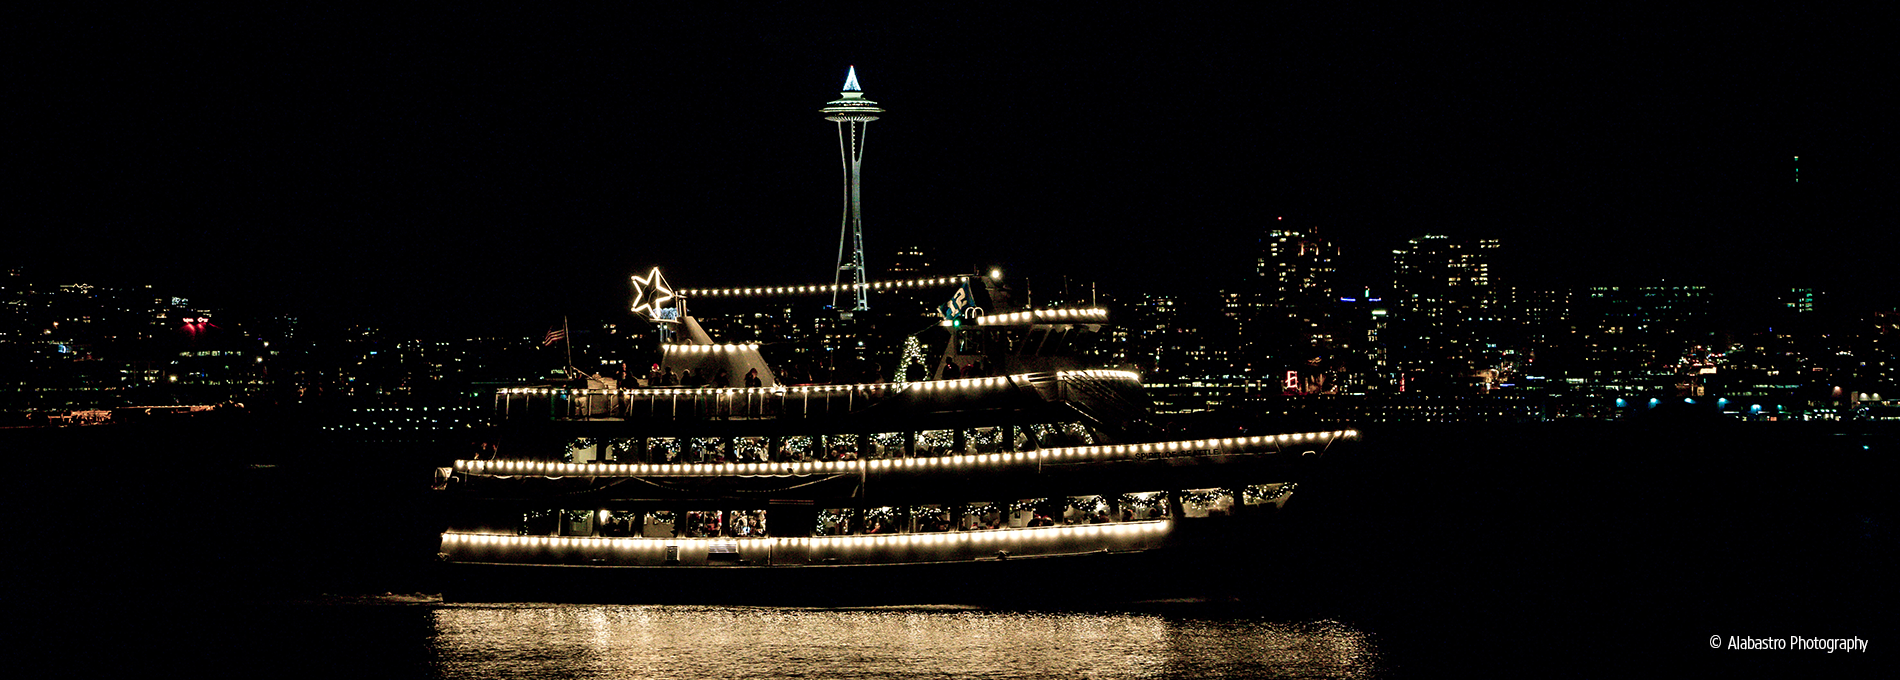
Image courtesy of argosycruises.com
Westlake Center Tree Lighting & Holiday Activities
401 Pine St., Seattle, WA 98101 (Westlake Park)
https://downtownseattle.org/events/holidays/
https://downtownseattle.org/events/holidays
- Tree Lighting Celebration: Nov. 24 at 3:30 pm in Westlake Park.
- Luminous Light Sculptures: Nov. 24, 2023 – Jan. 9, 2024 in Westlake Park.
- Holiday Lights & Delights: Nov. 25, 2023 – Jan. 9, 2024 in Occidental Square.
- Sweet & Snowy Saturdays: Nov. 25, 2023 – Dec. 16, 2023 | 11:30 am – 1 pm in Occidental Square.
- Cost: Free for all ages
- Parking: Access the Republic Parking garage from Olive Way between 4th & 5th Ave, or check out this interactive map of city parking
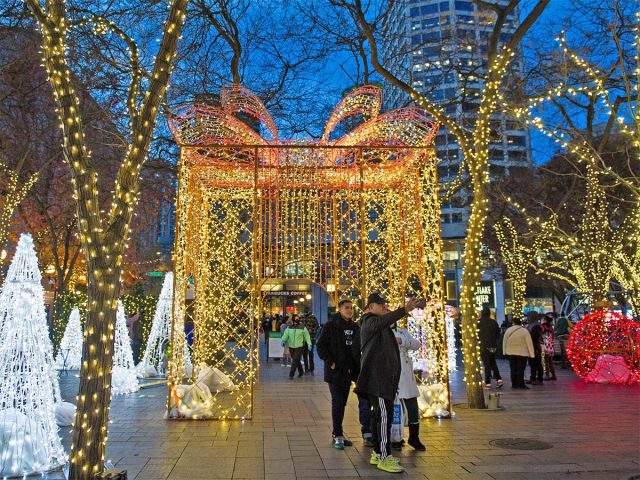
Photo Courtesy of Downtown Seattle Association
Zoolights at Point Defiance Zoo & Aquarium
5400 N Pearl St, Tacoma, WA 98407
www.pdza.org/event/zoolights
click here to get tickets
- Dates/Times: Open nightly Nov. 24, 2023 – Jan. 1, 2024 | 4:30 – 10 pm
- Cost: $14-$18 (free for kids 2 & under)
- Promotions: Discounted tickets for zoo members & BECU members
- Parking: Free parking in zoo lots (carpooling recommended)
- Food: Dinner, drinks & snacks are available at the Plaza Cafe & outside stands. Roast s’mores and pudgy pies around the fire on the Cafe Deck, too!
- Activities: Carousel, S’mores Roasting, Groovy Goats in Holiday Coats
- Holiday Closures: Dec. 24 & 25
Image courtesy of https://www.pdza.org
WildLanterns at Woodland Park Zoo
West Entrance: 5500 Phinney Ave. N, Seattle, WA 98103
South Entrance: 750 N 50th St, Seattle, WA 98103
www.zoo.org/wildlanterns
Click here to get tickets | Map
- Dates/Times: Open nightly Nov. 10, 2023 – Jan. 14, 2024 | 4:00 – 9:00 pm.
- Cost: $25.95 – $36.95 per person (ages 2 & under are free).
- Promotions: Zoo members get 20% off tickets; Holiday Senior Stroll on Nov 14 from 4-6 pm with 40% off for ages 65+
- Parking: $6 parking is available in all lots after 3:30 pm (here is a map). Park by the West Entrance (Penguin, Otter, or Bear Lot) if you are purchasing your tickets in person—the South Gate (Hippo Lot) is only for those who already have tickets.
- Food: Refreshments are available at food kiosks throughout, plus the Pizza Corner at 1899 Grove, and Gather & Graze Café (with covered seating provided). You are also welcome to bring your own food & non-alcoholic beverages.
- Special Activities: Tianyu Cultural Performances in the PACCAR Auditorium, Zoomazium, ZooStore, Carousel. Sensory-Friendly Nights on 11/15, 12/6 & 1/11.
- Closures: Most Mondays (open Dec. 11 & 18 + Jan 1); Nov. 23, Dec. 24 & 25.

Image courtesy of zoo.org
But wait, there’s more…
Holiday theatrical & musical shows
“A Christmas Carol” at ACT Theatre
The Great Figgy Pudding Caroling Competition
The Polar Express train ride at Mt. Rainier Railroad
Gingerbread Village at the Sheraton Grand Seattle
We earn the trust and loyalty of our brokers and clients by doing real estate exceptionally well. The leader in our market, we deliver client-focused service in an authentic, collaborative, and transparent manner and with the unmatched knowledge and expertise that comes from decades of experience.
© Copyright 2023, Windermere Real Estate/Mercer Island.
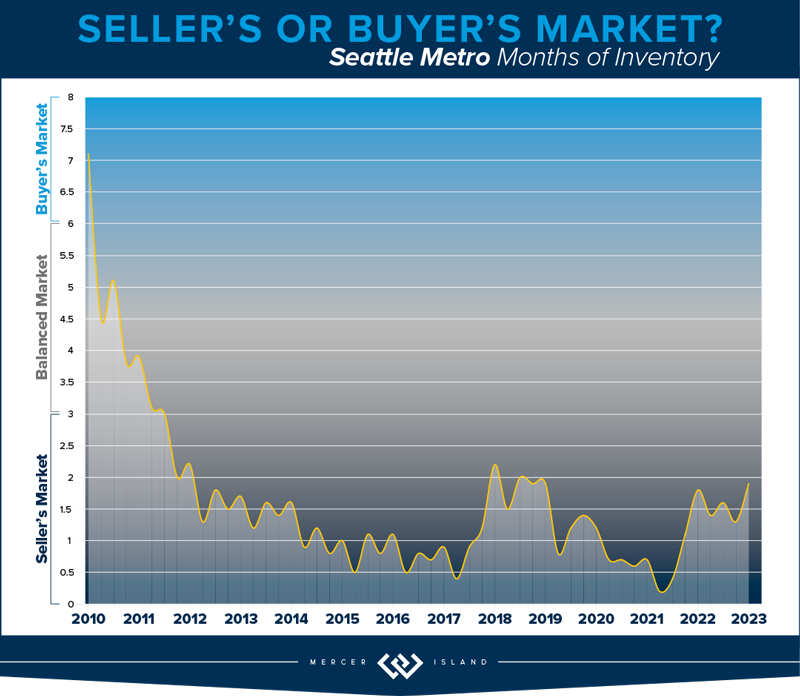
How’s the Market? Q3 2023 Review of Seattle Area Real Estate
While median sales prices varied quite a bit from area to area, they stayed relatively stable with most communities posting either modest gains or slight declines compared to this time last year. Low inventory is keeping us in what you might call a “flat” seller’s market…supply is low but prices aren’t appreciating as fast as we would normally see. That being said, if rates float down—and experts believe they will—we could see another frenzy of bidding wars as buyers compete for the few homes on the market. If you’re considering purchasing a home (even if you need to sell yours first), our advice is to get out there and start shopping while you can pick and choose at relatively reasonable prices…
Click or scroll down to find your area report:
Seattle | Eastside | Mercer Island | Condos | Waterfront
SEATTLE
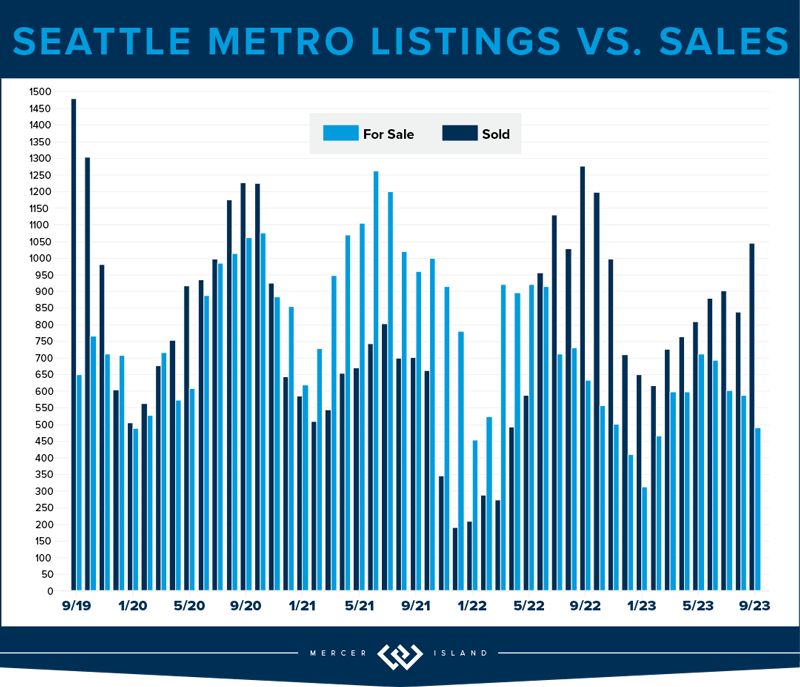
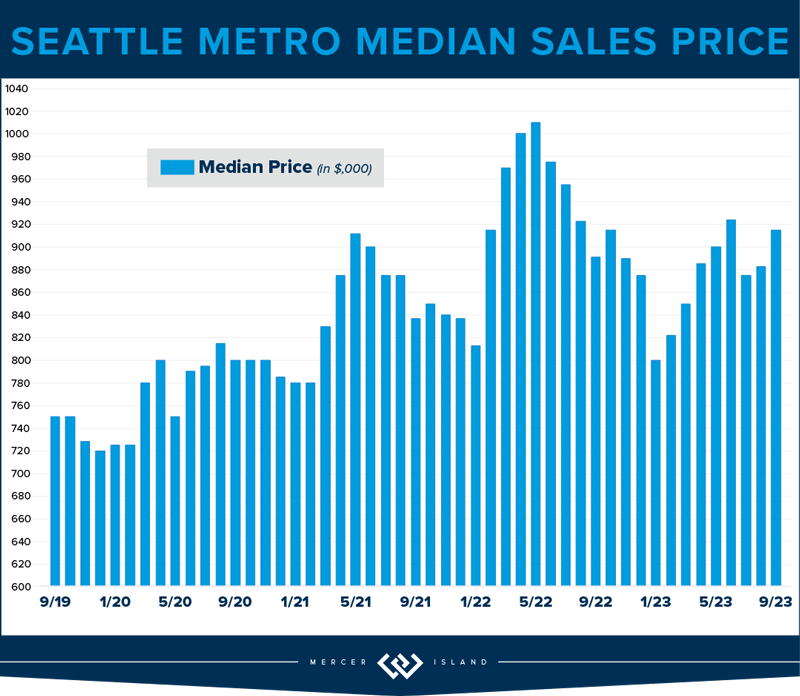
The Seattle residential market showed resilience in Q3 of 2023. While the $894,000 median sales price was down 3% from last year, 60% of sellers fetched sales at or above their list price and 58% sold within the first 10 days. The city saw 2,321 new listings, a 23% reduction from the previous year. This is healthy, for now, with decreased demand due to rising interest rates. When rate pricing eases—and it will according to experts—the lower inventory will be sure to send prices through the roof. NOW IS THE TIME!
Diving deeper into communities, Queen Anne, with its blend of historic charm and modernity, saw a 1% rise in median sales prices to $1,349,000. Kenmore and Lake Forest Park have also held their own—60% of homes sold within the first ten days and both median sales prices and cost-per-square-foot went up 2% over last year. North Seattle remains a strong contender in the market, with 68% of homes selling at or above the list price. West Seattle, with its coastal vibe, saw a remarkable 72% of homes sell at or above the listing price.
The data underscores Seattle’s diverse and dynamic housing landscape, where different communities cater to varied tastes, yet all show promise and potential. Overall, Seattle’s housing market is marching on, optimistically steady, backed by strong analytical data and historically low unemployment.
Click here for the full report and neighborhood-by-neighborhood statistics!
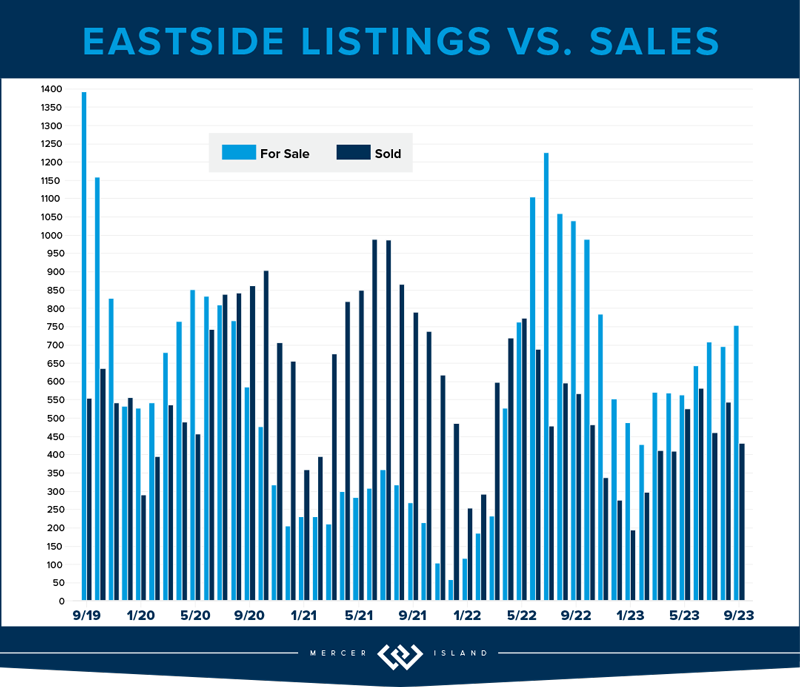
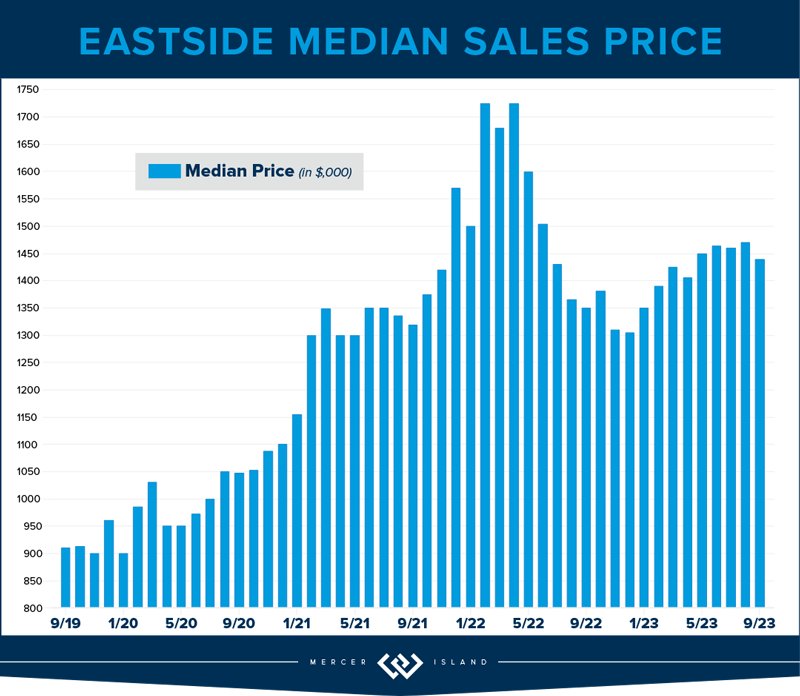
EASTSIDE
The Eastside showed steady growth in Q3. With a notable 5% year-over-year rise in home values, the median sales price landed at a respectable $1,460,000. Interestingly, cost per square foot ($625) showed virtually no YOY change. Sellers saw a close alignment with their expectations, as the average list price to sale price for all properties stood at 99%. Furthermore, 58% of homes sold at or above their listing price, a testament to the region’s enduring demand.
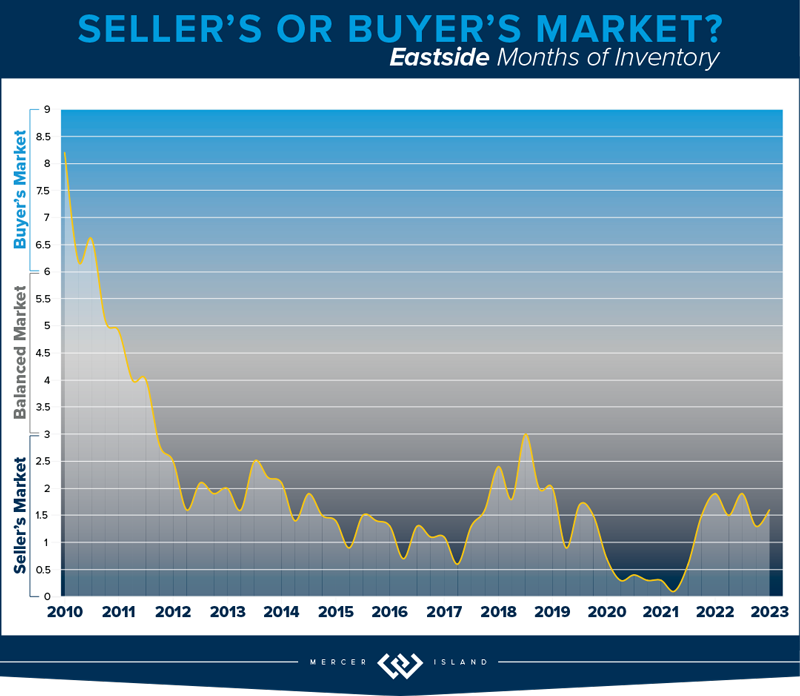
Diving deeper, most communities remained fairly stable with modest year-over-year increases. Redmond, Mercer Island and Newcastle/North Renton saw slight declines. The star of the Eastside was West Bellevue, posting 23% more sales than Q3 of last year, a median sales price hike of 14%, and the highest cost-per-square-foot in the region (even after a 14% drop from last year). While overall sales were down about 13% across the region, this was counterbalanced by a 20% drop in new listings keeping the Eastside in a flat seller’s market for the foreseeable future.
Our conclusion? The Eastside’s market remains robust and versatile. Buyers and sellers both need to be savvy, understanding both their micro-markets and the broader trends. For sellers, strategic pricing and presentation remain king! Our advice to buyers: don’t sleep on this market, it will turn fast when interest rates float downward and inventory will not be able to keep up with demand.
Click here for the full report and neighborhood-by-neighborhood statistics!
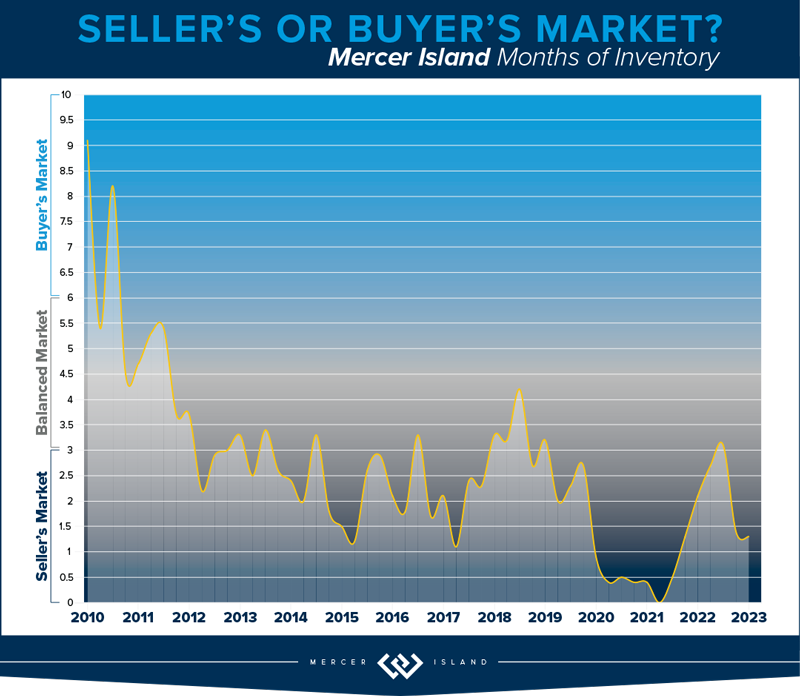
MERCER ISLAND
While Mercer Island’s Q3 median sales price of $2,368,000 was still down slightly compared to Q3 of last year, prices have been trending upward since the beginning of the year. Furthermore, the average price-per-square-foot in Q3 was actually up 6% over last year. More than half of homes sold at or above their list prices (53%) and in 10 days or less (57%)—this is right on par with what we saw in Q3 of 2022. Buyers found room to negotiate on the remaining listings and were able to add contingencies for things like inspections and financing.
We saw a boost in sales compared to last year’s initial interest rate shock, despite a lower number of new listings. This has kept the Island in a flat seller’s market much like we saw in 2018. That being said, Mercer Island homes are taking longer to sell than we saw last year—the average total number of days properties spent on the market before receiving an offer went from 18 days in Q3 2022 to 30 days by Q3 2023. Buyers, perhaps more hesitant due to higher interest rates, are being careful to pick and choose before leaping into a contract.
Overall, the Mercer Island real estate market has remained fairly steady with some signs of growth. While median prices are still down from their spike during the post-COVID frenzy, we should start seeing year-over-year gains if this year’s upward trend continues. For prospective buyers, the landscape offers an opportunity to negotiate favorable deals on those properties that don’t sell right away. For sellers, astute pricing and marketing strategies will continue to win the day.
Click here for the full report and neighborhood-by-neighborhood statistics!
CONDOS – SEATTLE & EASTSIDE
The PNW condo market showed steady growth in Q3 of 2023, with year-over-year median sales prices up by 6% in both Seattle and The Eastside. Overall activity was subdued, however, with a drop in the number of new condo listings corresponding with fewer sales.
When dissecting Seattle’s condo statistics, Shoreline, Lake Forest Park and Kenmore saw the biggest price gains with a whopping 39% rise in median sales price compared to last year. Ballard and Green Lake also saw big gains with median sales price up 25%. Conversely, Shoreline experienced a stark 59% drop in sales and 40% drop in median sales prices, indicating possible shifts in buyer preferences toward the more convenient city center. While Downtown condo sales prices were also down slightly, their shimmering skylines still fetched a premium at $825 per square foot.
The Eastside condo market varied from area to area. Kirkland’s condo sales surged by 18%, with an impressive 43% increase in median sale price. Redmond also shone brightly with a 45% spike in median sale prices. Mercer Island stood out, with its 43% increase in the number of sales and 31% rise in median sale price showcasing its luxury market segment. Conversely, West Bellevue, East Bellevue, and East Lake Sammamish all posted lower year-over-year median sales prices—down -20%, -%12% and -7% respectively.
The juxtaposition of these two markets, and really the neighborhood specific swings within them, highlights the unique characteristics and demands of each, underscoring the need for prospective buyers and sellers to strategize based on specific community data. All the more reason to consult a condo pro!
Check out area-by-area details the full condo report.
WATERFRONT
Seattle once again commanded the highest number of private waterfront sales with 9 total—4 of these sold in 4 days or less, including 2 hot Beach Drive listings in West Seattle that sold above their asking prices. Lake Sammamish was close behind with 8 sales including one that sold immediately (and marked the most affordable waterfront sale at $1.62 million). Mercer Island boasted the highest waterfront sale of the quarter, a stunning North End estate on 120 feet of waterfront that went for $24.4 million. The Eastside held its own with 6 sales and the second highest sale of the quarter—$12 million—for a half-acre Yarrow Point estate on 105 feet of prime west-facing waterfront.
This brief overview of the entire Seattle-Eastside private waterfront market, including Mercer Island and Lake Sammamish, illustrates the trends occurring in our region over time. This data is interesting and insightful but cannot replace an in-depth waterfront analysis with your trusted professional.
We earn the trust and loyalty of our brokers and clients by doing real estate exceptionally well. The leader in our market, we deliver client-focused service in an authentic, collaborative, and transparent manner and with the unmatched knowledge and expertise that comes from decades of experience.
© Copyright 2023, Windermere Real Estate/Mercer Island. Information and statistics derived from Northwest Multiple Listing Service and Trendgraphix, and deemed accurate but not guaranteed. Seattle cover photo courtesy of Codi Nelson and HD Estates. Eastside cover photo courtesy of Team RAREnorthwest and Elevato Photography. Condo cover photo courtesy of Jessica Livingston and im3rd Media. Waterfront cover photo courtesy of Anni Zilz and Clarity Northwest Photography.
2023 Football & Hockey Schedules, Recipes & Tips…

Football is BACK and hockey is coming in hot! Scroll down for printable schedules, tailgating hacks (including how to pack the perfect cooler!), and favorite gameday recipes. Fans of all ages will also love our printable bingo sheets.
Need to brush up on your sports lingo? Check out Wikipedia’s handy football and hockey glossaries. You can say impressive things like, “Are they running a 3-4 defense?” and “It’s not icing unless the puck passes the goal line…”


We earn the trust and loyalty of our brokers and clients by doing real estate exceptionally well. The leader in our market, we deliver client-focused service in an authentic, collaborative, and transparent manner and with the unmatched knowledge and expertise that comes from decades of experience.
© Copyright 2023, Windermere Real Estate/Mercer Island.
Extended! Kicks for Kids Shoe Drive August 1-21

Help us give kids the confidence they need to start the school year right! My Windermere team and I invite you to participate in our Kicks for Kids back-to-school sneaker drive. It connects low-income youth in our local communities with new shoes for the upcoming school year. Through August 21st, we’ll be accepting donations 3 ways:
-
Bring new or gently used sneakers (toddler/youth sizes) to my office at 2737 77th Ave SE, Ste. 100, Mercer Island. We’ll enter your name into a raffle for a delectable prize from Island Treats, and we’ll also match the first 100 pairs of shoes donated!
-
Shop from our Amazon Wishlist.
-
Contact me to arrange a pickup.

This year, we’re partnering once again with KidVantage (formerly Eastside Baby Corner), an amazing organization that helps kids thrive by providing resources and essentials with their 70+ partner agencies—many of which are school districts.
Help us make sure every child has a new pair of shoes for school!
![]()

© Copyright 2023, Windermere Real Estate/Mercer Island.
How’s the Market? Q2 2023 Review of Seattle Area Real Estate
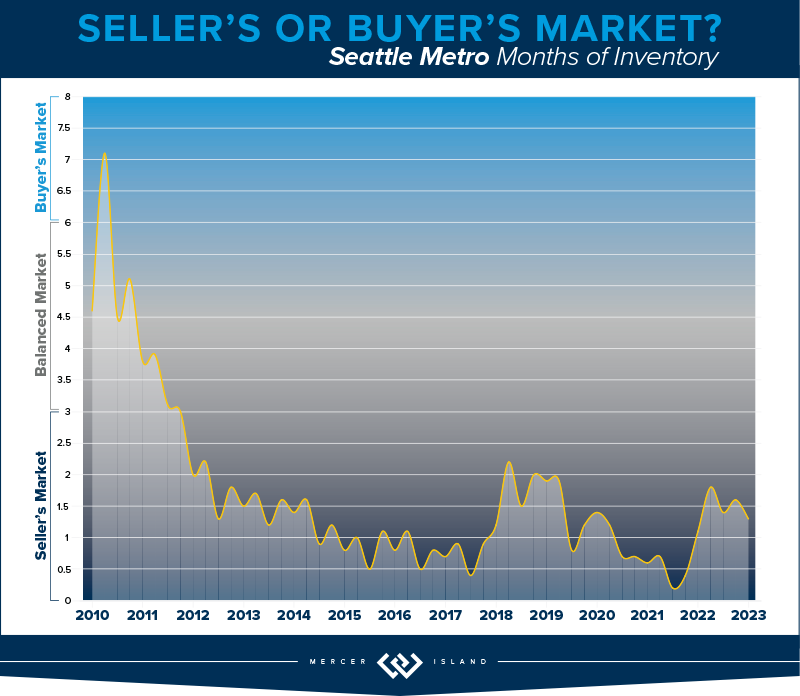
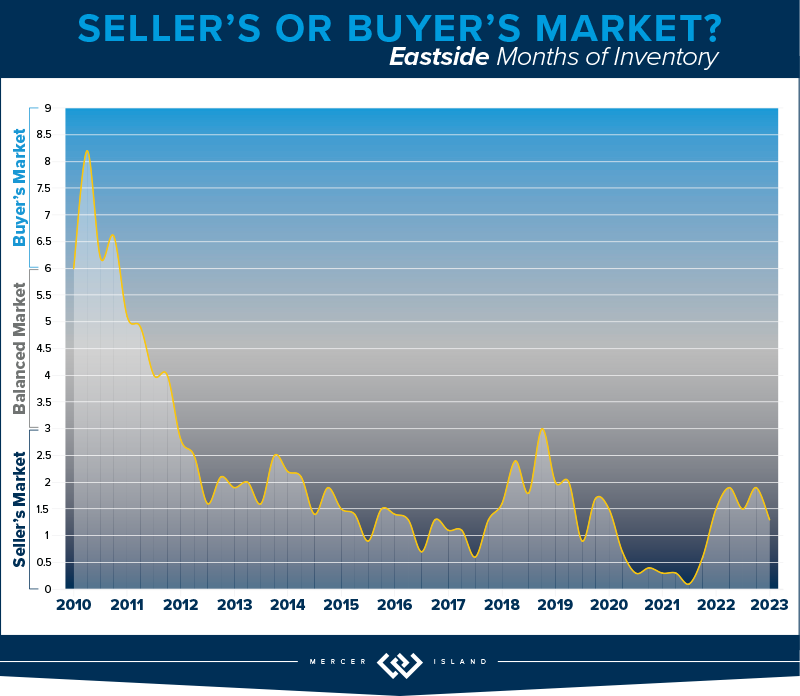
While median sales prices rose in Q2 compared to Q1, they were still down about 10% from last summer’s peak. Most areas saw fewer new listings and sales this year than we saw last year. Supply levels are still low enough to keep us technically in a seller’s market — our Windermere Chief Economist, Matthew Gardner, predicted this will continue, saying, “with relatively few homes on the market and the share of homes with price reductions dropping and list prices rising again, I just can’t see a buyer’s market appearing this year.”
Click or scroll down to find your area report:
Seattle | Eastside | Mercer Island | Condos | Waterfront
SEATTLE
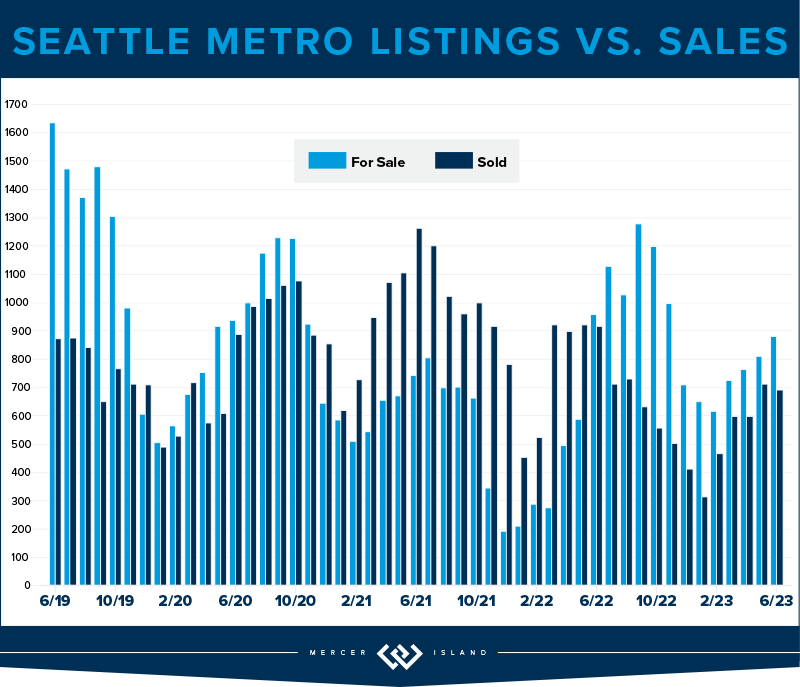
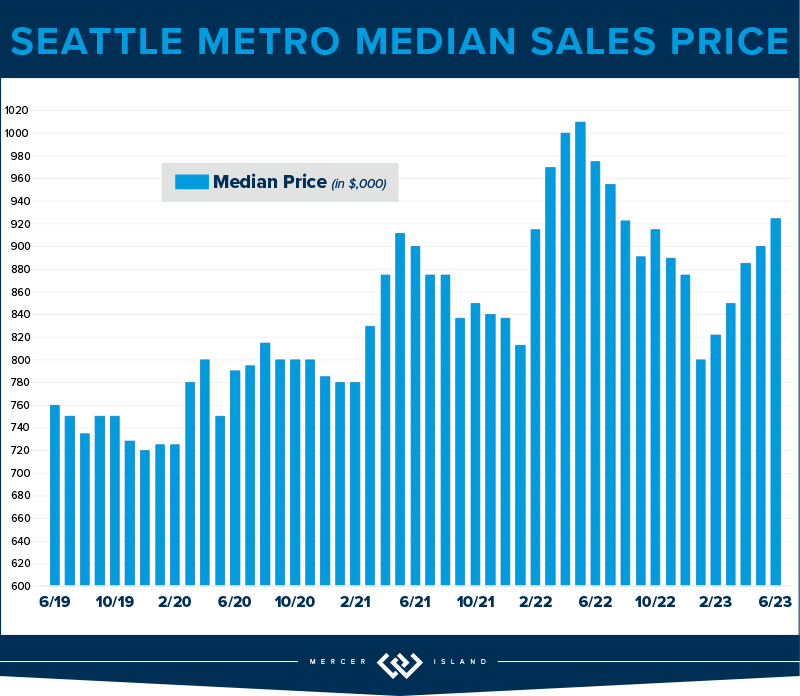
The Seattle market felt a similar adjustment as the Eastside with home prices down about 10% across the board. This spring market had a 27% drop in supply which limited the overall sales. The median closed sales price of $900,000 is up from May’s $830,000, but down 10% year over year offering some relief to buyers feeling the squeeze of high interest rates.
Last quarter, we mentioned keeping an eye on North Seattle and the growth we’ve seen in Shoreline, Lake Forest Park and Kenmore likely due to transit and those seeking affordability. Interestingly, 80% of the Lake Forest Park and Kenmore homes sold at or above their list price (in comparison to Queen Anne at 62%, for example) with prices rising 14% since last quarter but down 19% year over year.
Q2 closed with 879 active residential homes on the market, but no real sense of urgency from buyers (although the average days on market was 20 compared to the Eastside’s 23 days). The presentation of a home coupled with a smart pricing strategy equates to a positive outcome for sellers — we can see this in the 42% of homes that experienced multiple offers with an average boost of 6% over list price. With that said, 26% of Seattle contracts experienced a price negotiation between parties, so if you’re a motivated buyer and write an offer, you could benefit from more traditional contract terms.
Click here for the full report and neighborhood-by-neighborhood statistics!
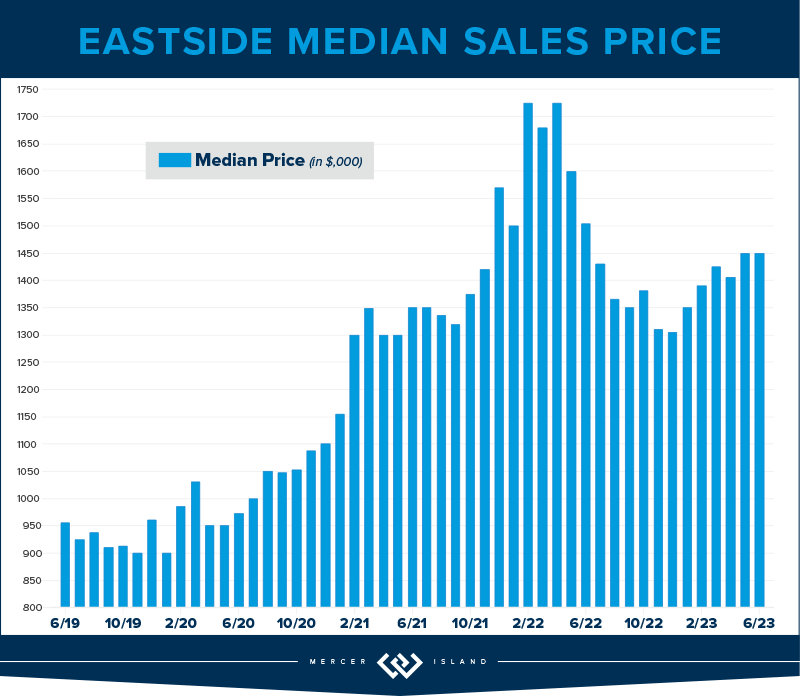
EASTSIDE
The Eastside residential market adjusted significantly this quarter. With a median price of $1,450,000 across all neighborhoods, this is an adjustment of 10% compared to last year. West Bellevue real estate, a luxury market, took the largest adjustment of 16%, down to an average of $996 per square foot. Market times were also slightly longer with 66% of homes selling within the first 10 days; the other 34% of homes had to be more patient in finding their buyer. This means that it took an average of 23 days for a seller to sell their property compared to 7 days at this time last year. However, this is much improved from 52 days in Q1!
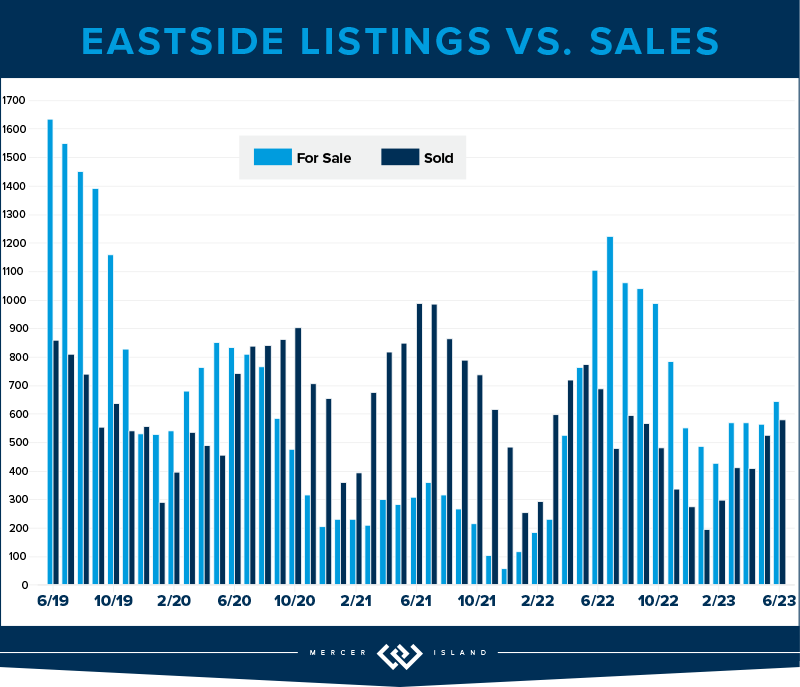
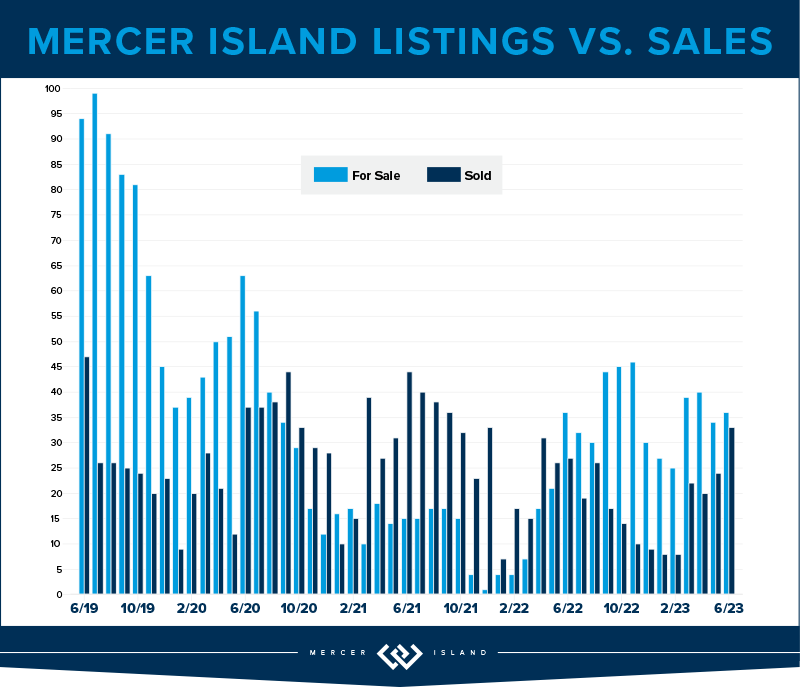
Just like Redmond’s condos, its single family residential supply numbers were down 43%—but offered more supply than this time last year. Overall, there were 40% fewer listings than in Q2 of last year. With just 645 active homes available at the end of this quarter and rates closing out ~6.75%, low supply and high interest rates have kept sales stagnant. This time last year, there were 1,105 homes available for sale and rates had just moved across the 5% level.
It’s very true that sales are still happening and price and presentation from the seller matter most. On the Eastside, 39% of homes sold above their list price at an average of 5% over. Many buyers have adjusted their budget with the higher rates and seem motivated to get into the market now when the right home is found. If you can afford the payment, take the leap as a buyer. Sellers are motivated to accept more traditional terms, and you may not be competing amongst others.
Click here for the full report and neighborhood-by-neighborhood statistics!
MERCER ISLAND
Much like other Eastside neighborhoods, Mercer Island made a significant adjustment in price—but one area of difference is that supply has remained steady. The south end offered the largest number of sold homes with 20, followed by 16 sold homes mid-island and 12 sold homes on the north end. Mid-island pricing continues to be smack in the middle with an average median sales price of $2,249,000; 75% of mid-island homes sold at or above their listing price, evidence that the desirability of being tucked away from freeway and amenities while still accessible to all is very appealing. Overall, island pricing has adjusted by 19% year over year to a median of $2.2 million compared to $2.7 million this same time last year.
There are currently 36 active homes on the market at the end of this quarter, which is identical to our supply level Q2 last year! This is up slightly from 39 active homes at the end of last quarter. The island is also feeling the pause in demand and urgency and that’s evident in the days on market numbers. Average days on market was 31 this quarter; it only took 7 days to sell your home this time last year. The inventory of homes for sale continues to be unique and striking, and a great pricing strategy equates to both happy seller and happy buyer.
Click here for the full report and neighborhood-by-neighborhood statistics!
CONDOS – SEATTLE & EASTSIDE
For first time homebuyers, condos are still a fantastic starter purchase, whether you want to invest, live in the city or in a more suburban environment. We didn’t experience the same urgency with condo buyers this Spring likely because of interest rates, the fear of tech layoffs, or the transition from remote work to office work.
Year over year, neighborhoods like West Seattle, North Seattle, Queen Anne and Ballard saw strong price gains while South Seattle and Capitol Hill took a 20% median price adjustment. While it’s tough to find a direct correlation for neighborhoods tracking significantly different than others, the price gains are likely due to supply issues in these popular neighborhoods. On the flip side, price adjustments could be a sign that sellers had higher expectations of price before correcting to a normal level with a reduction or negotiation. There were 565 units available at the close of the quarter, down from 605 active units at the close of Q2 last year. Sellers are likely staying put for now, or they are investors with a low interest rate mortgage. Lake Forest Park and Shoreline condos triumphed over others with 81 percent of the 16 total condos selling at or above their list price; 70% of these units sold within the first week.
On the eastside, East Bellevue and East of Lake Sammamish had rising median prices with an average increase of 6% year over year, while other eastside neighborhoods adjusted downward. Redmond condo supply was down 41 percent! Again, this number reflects sellers staying put and with current interest rates hovering around 6.5% today, there may not be a suitable option for them to consider “trading up” to a larger unit or a single family home. With lack of supply and high rates, total sales are stagnant.
Check out area-by-area details the full condo report.
WATERFRONT
Most of the waterfront sales this quarter happened in Seattle with 14 sold homes compared to 6 sold homes last quarter. Just two Mercer Island waterfront properties, located on the north end, sold this quarter (the same number of sales as last quarter!) one with significant competition selling $750,000 above its listing price in just four days. In regard to eastside waterfront homes, while there was just seven sales (also the same number of sold homes as Q1 this year), four of those homes sold in five days or less including a $14m waterfront property on Hunts Point.
This brief overview of the entire Seattle-Eastside private waterfront market, including Mercer Island and Lake Sammamish, illustrates the trends occurring in our region over time. This data is interesting and insightful but cannot replace an in-depth waterfront analysis with your trusted professional.
© Copyright 2023, Windermere Real Estate/Mercer Island. Information and statistics derived from Northwest Multiple Listing Service and Trendgraphix, and deemed accurate but not guaranteed. Mercer Island cover photo courtesy of Cynthia Schoonmaker and Clarity Northwest Photography. Eastside cover photo courtesy of Joe Liu and Clarity Northwest Photography. Condo cover photo courtesy of Team RAREnorthwest and Elevato Photography.
2023 Seattle & Eastside Farmers Markets: Locations, Times & More

Summer is finally here, and so are these farmers markets! Spend an evening or weekend finding your new favorites among the tents. Think it’s all about kale? Think again. Most offer live entertainment along with a mouth-watering variety of local brews, cheese, bread, meat/seafood, honey, hand roasted coffee, and other hidden gems (in addition to the freshly picked fruits & veggies).
Seattle Metro
- Ballard
- Capitol Hill (Broadway)
- Columbia City
- Lake City
- Lake Forest Park
- Madrona
- Magnolia
- Phinney
- Pike Place
- Queen Anne
- Shoreline
- U-District
- Wallingford
- West Seattle
Greater Eastside
- Bellevue – Crossroads
- Bellevue – Downtown
- Carnation
- Duvall
- Issaquah
- Kirkland – Downtown
- Kirkland – Juanita
- Mercer Island (Sponsored by Windermere MI!)
- North Bend
- Redmond
- Renton
- Sammamish
- Woodinville

Seattle Metro
Ballard
Seattle’s first year-round Farmers Market, selling produce exclusively from Washington state farmers along the historic cobblestone stretch of Ballard Ave.
Sundays, 9am – 2pm | Year-Round
5345 Ballard Ave NW | Seattle
sfmamarkets.com/visit-ballard-farmers-market/
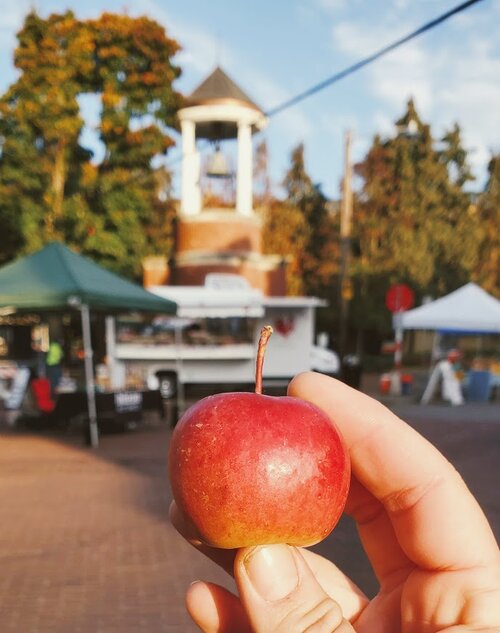
Photo courtesy of sfmamarkets.com
Capitol Hill (Broadway)
Come for Sunday brunch from food vendors who source ingredients from local, WA state farms (many of whom you’ll also meet selling their wares at the market). Live music and street performers often make an appearance, too.
Sundays, 11am – 3pm | Year-Round
Tuesdays, 3pm – 7pm (July 11 – September 26, 2023)
E Barbara Bailey Way | Seattle
seattlefarmersmarkets.org/chfm
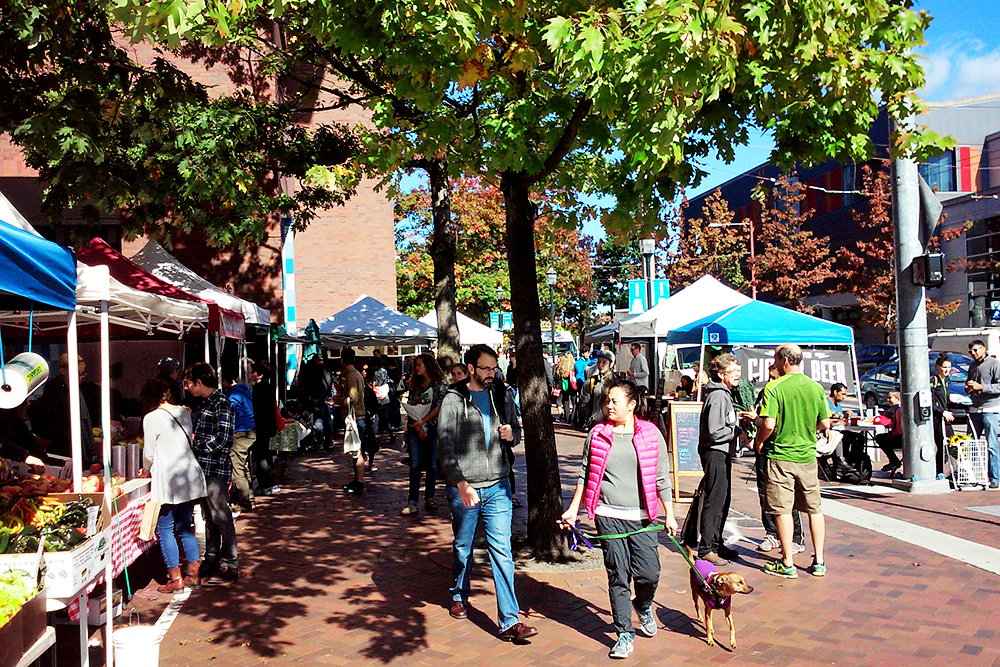
Photo courtesy of do206.com
Columbia City
With everything from freshly harvested Asian greens to Ethiopian eats, come check out the immense variety King County’s most diverse zip code has to offer. Bring your bounty to adjacent Columbia Park for a picnic.
Wednesdays, 3pm – 7pm | May 3 – Oct 11, 2023
37th Ave S | Seattle
seattlefarmersmarkets.org/ccfm
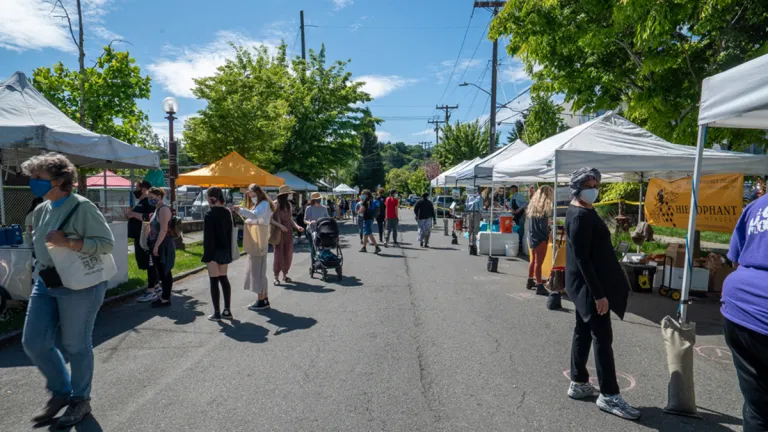
Photo courtesy of SouthSeattleEmerald.com
Lake City
This celebrated North End seasonal market offers unique finds grown and prepared by local farms and food artisans. Enjoy kids’ activities, too!
Thursdays, 3pm – 7pm | June 8 – Oct 5, 2023
NE 125th St & 28th Ave NE | Seattle
seattlefarmersmarkets.org/lcfm
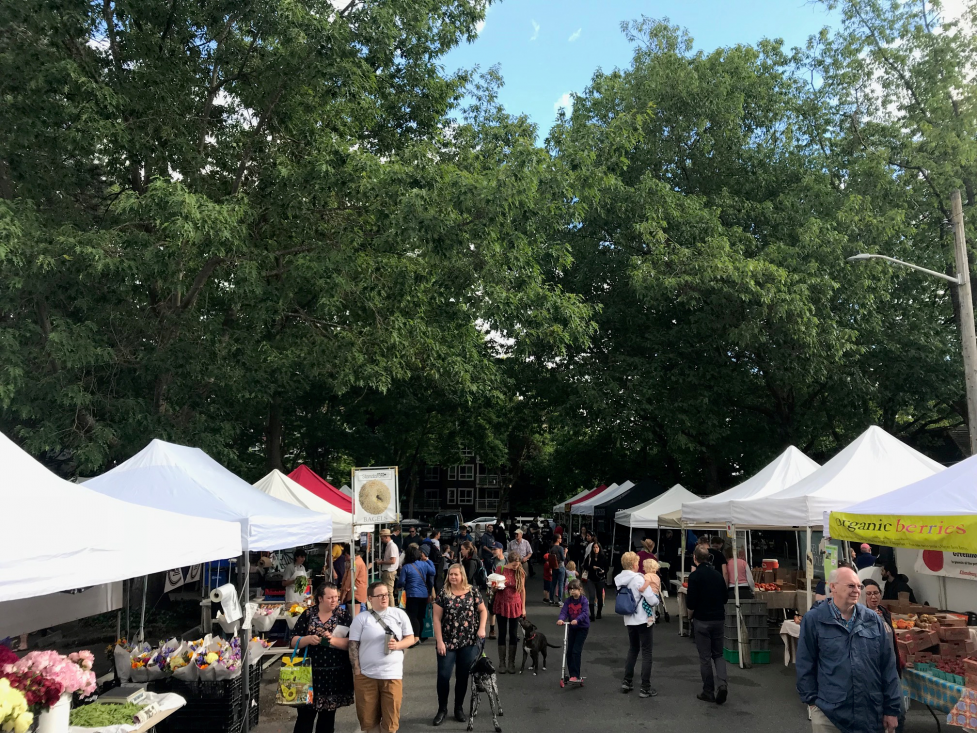
Photo courtesy of enjoylakecity.org
Lake Forest Park
With an emphasis on fresh, locally grown food, this market is an epicurean’s delight. Browse hard cider, baked goods, preserves, meat, pasta, sauces, and prepared foods along with the locally harvested fruits and veggies. There is also one “Crafts Market” each summer featuring local artisans.
Sundays, 10am – 2pm | May 14 – Oct 15, 2023
17171 Bothell Way NE | Lake Forest Park
www.thirdplacecommons.org/farmers-market
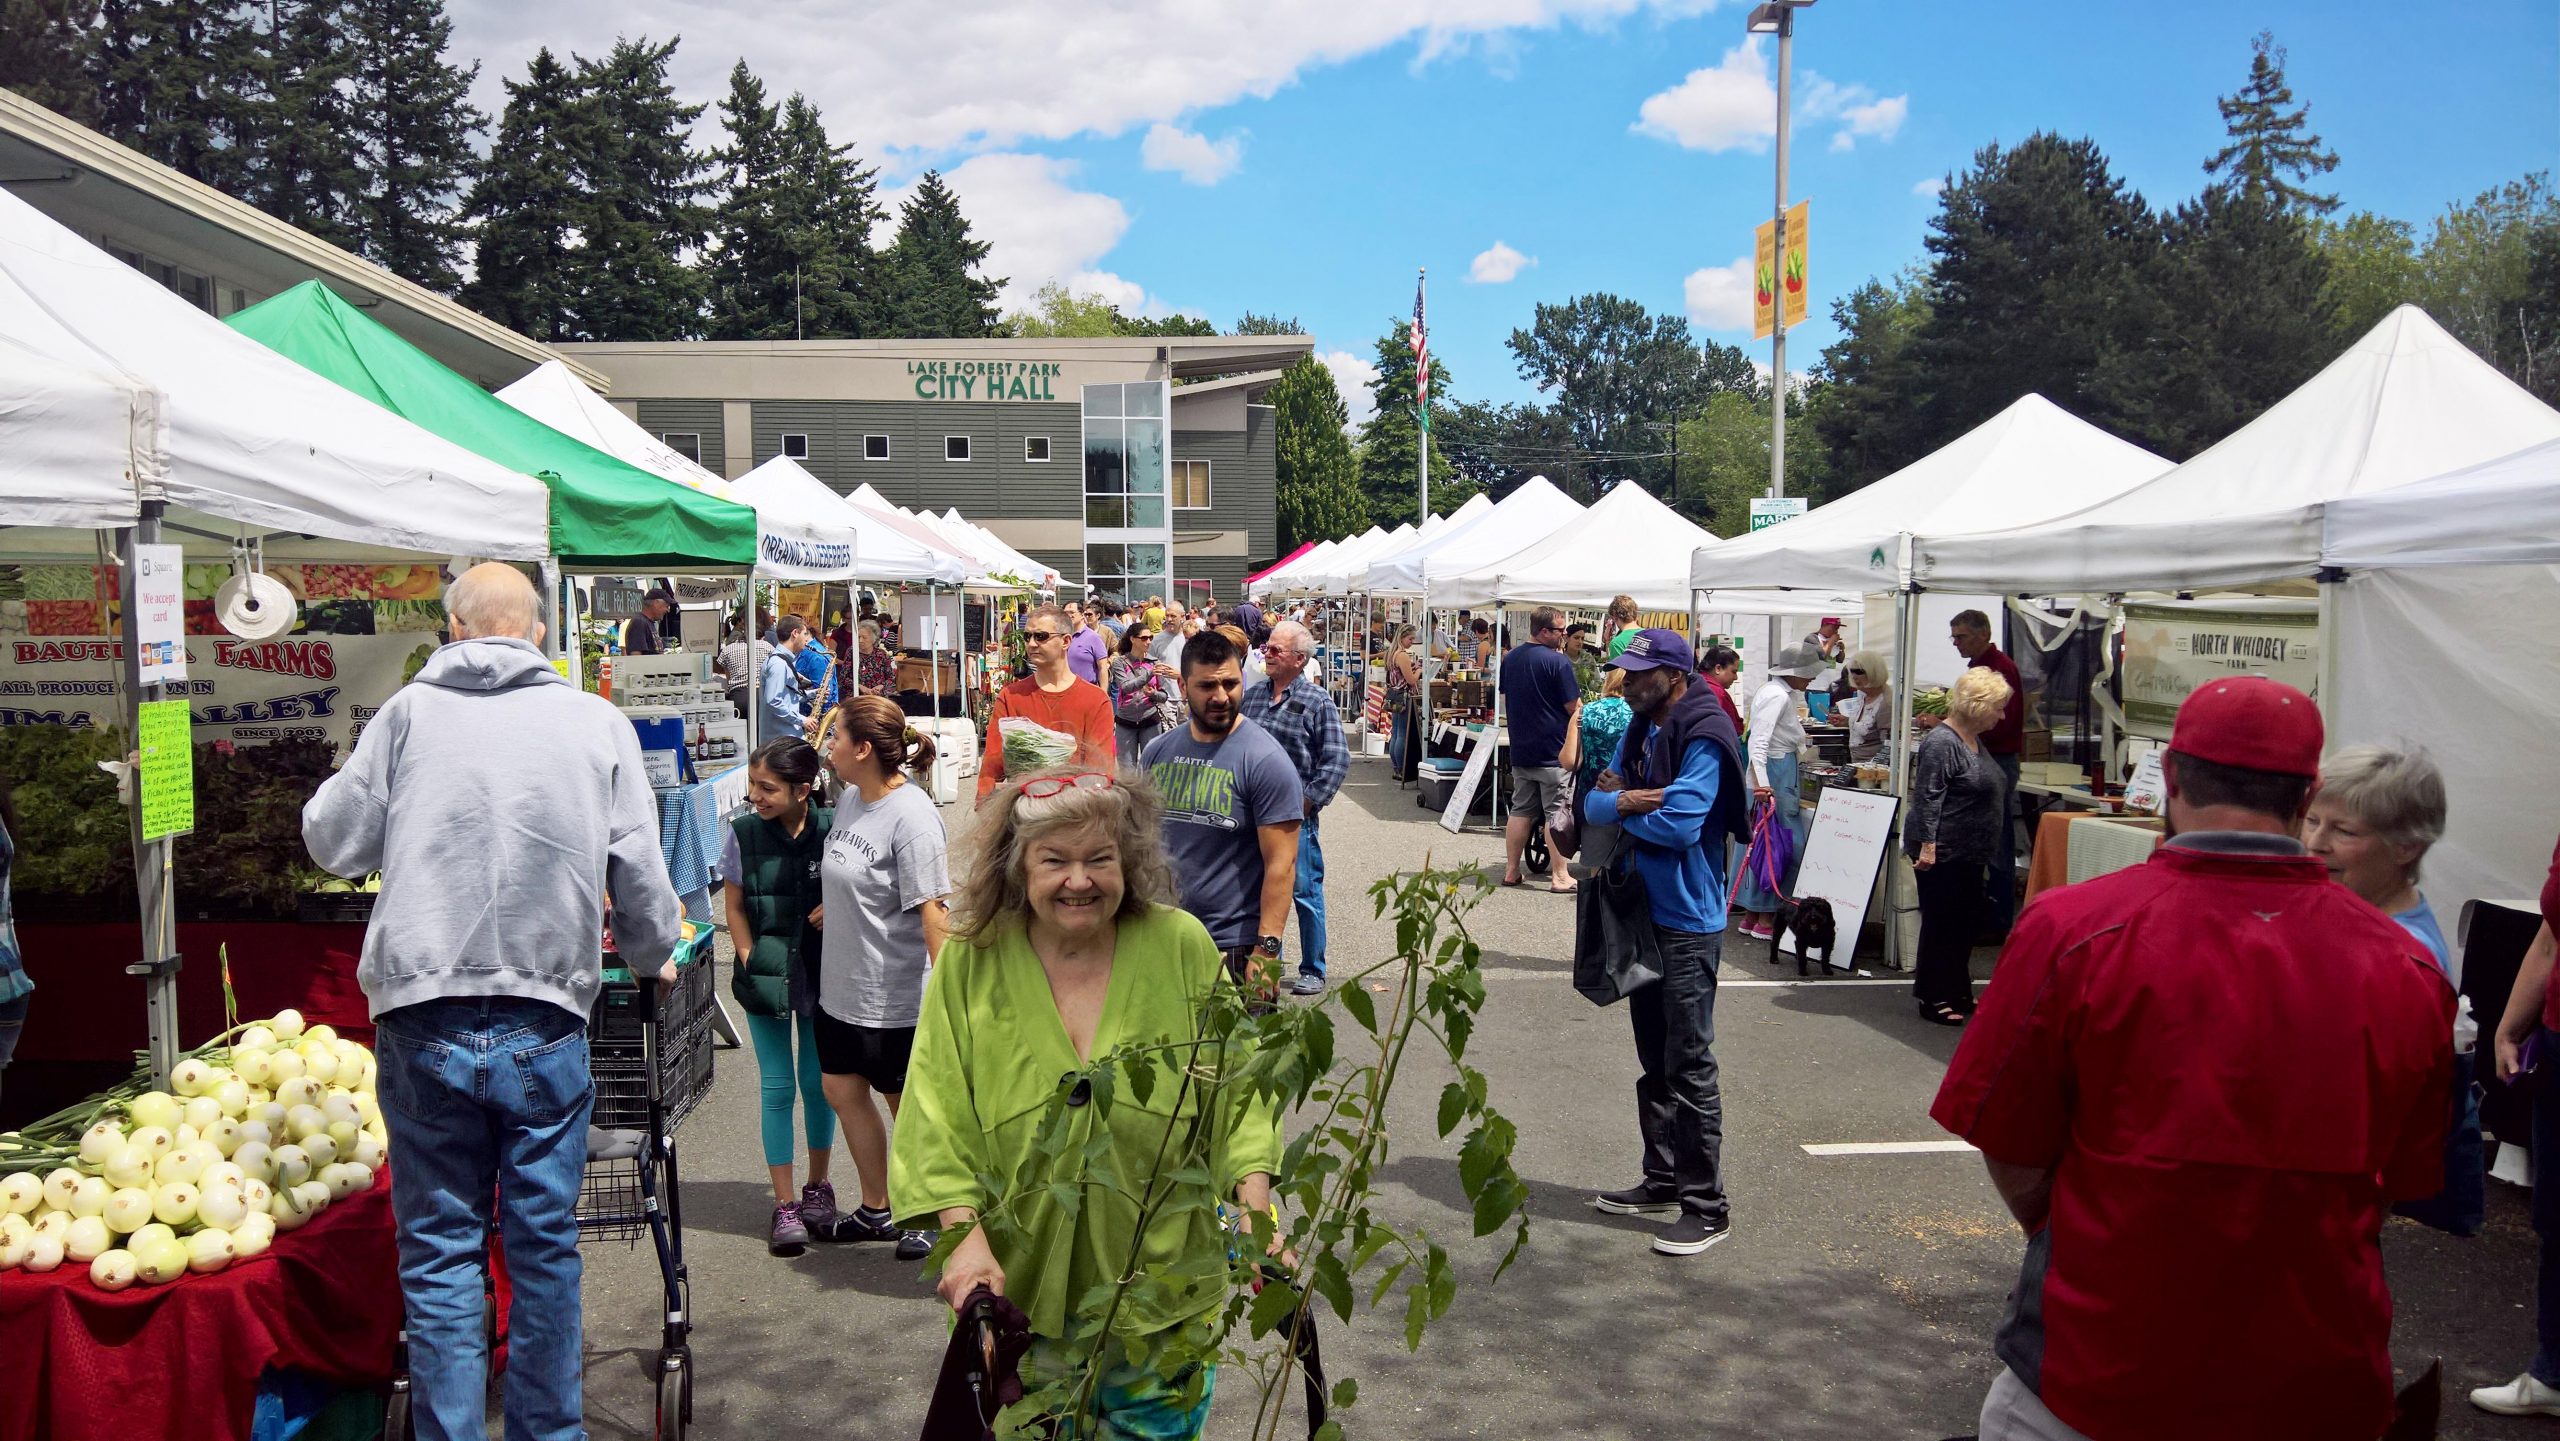
Photo courtesy of www.thirdplacecommons.org
Madrona
Located in one of Seattle’s most diverse neighborhoods, you’ll find artisan foods as well as seasonal produce from Washington state farmers, fishers, and ranchers.
Fridays, 3pm – 7pm | May 12 – Oct 27, 2023
MLK Way & E Union St | Seattle
sfmamarkets.com/madrona-farmers-market

Photo courtesy of sfmamarkets.com
Magnolia
This popular Saturday market is nestled in the tree-lined Magnolia Village. In addition to seasonal fruits and veggies, you’ll find sweet & savory pies, fresh bread, flowers, and more!
Saturdays, 10am – 2pm | June 3 – Oct 14, 2023 + Harvest Market on Nov 18, 2023
W McGraw St & 33rd Ave W | Seattle
seattlefarmersmarkets.org/mfm
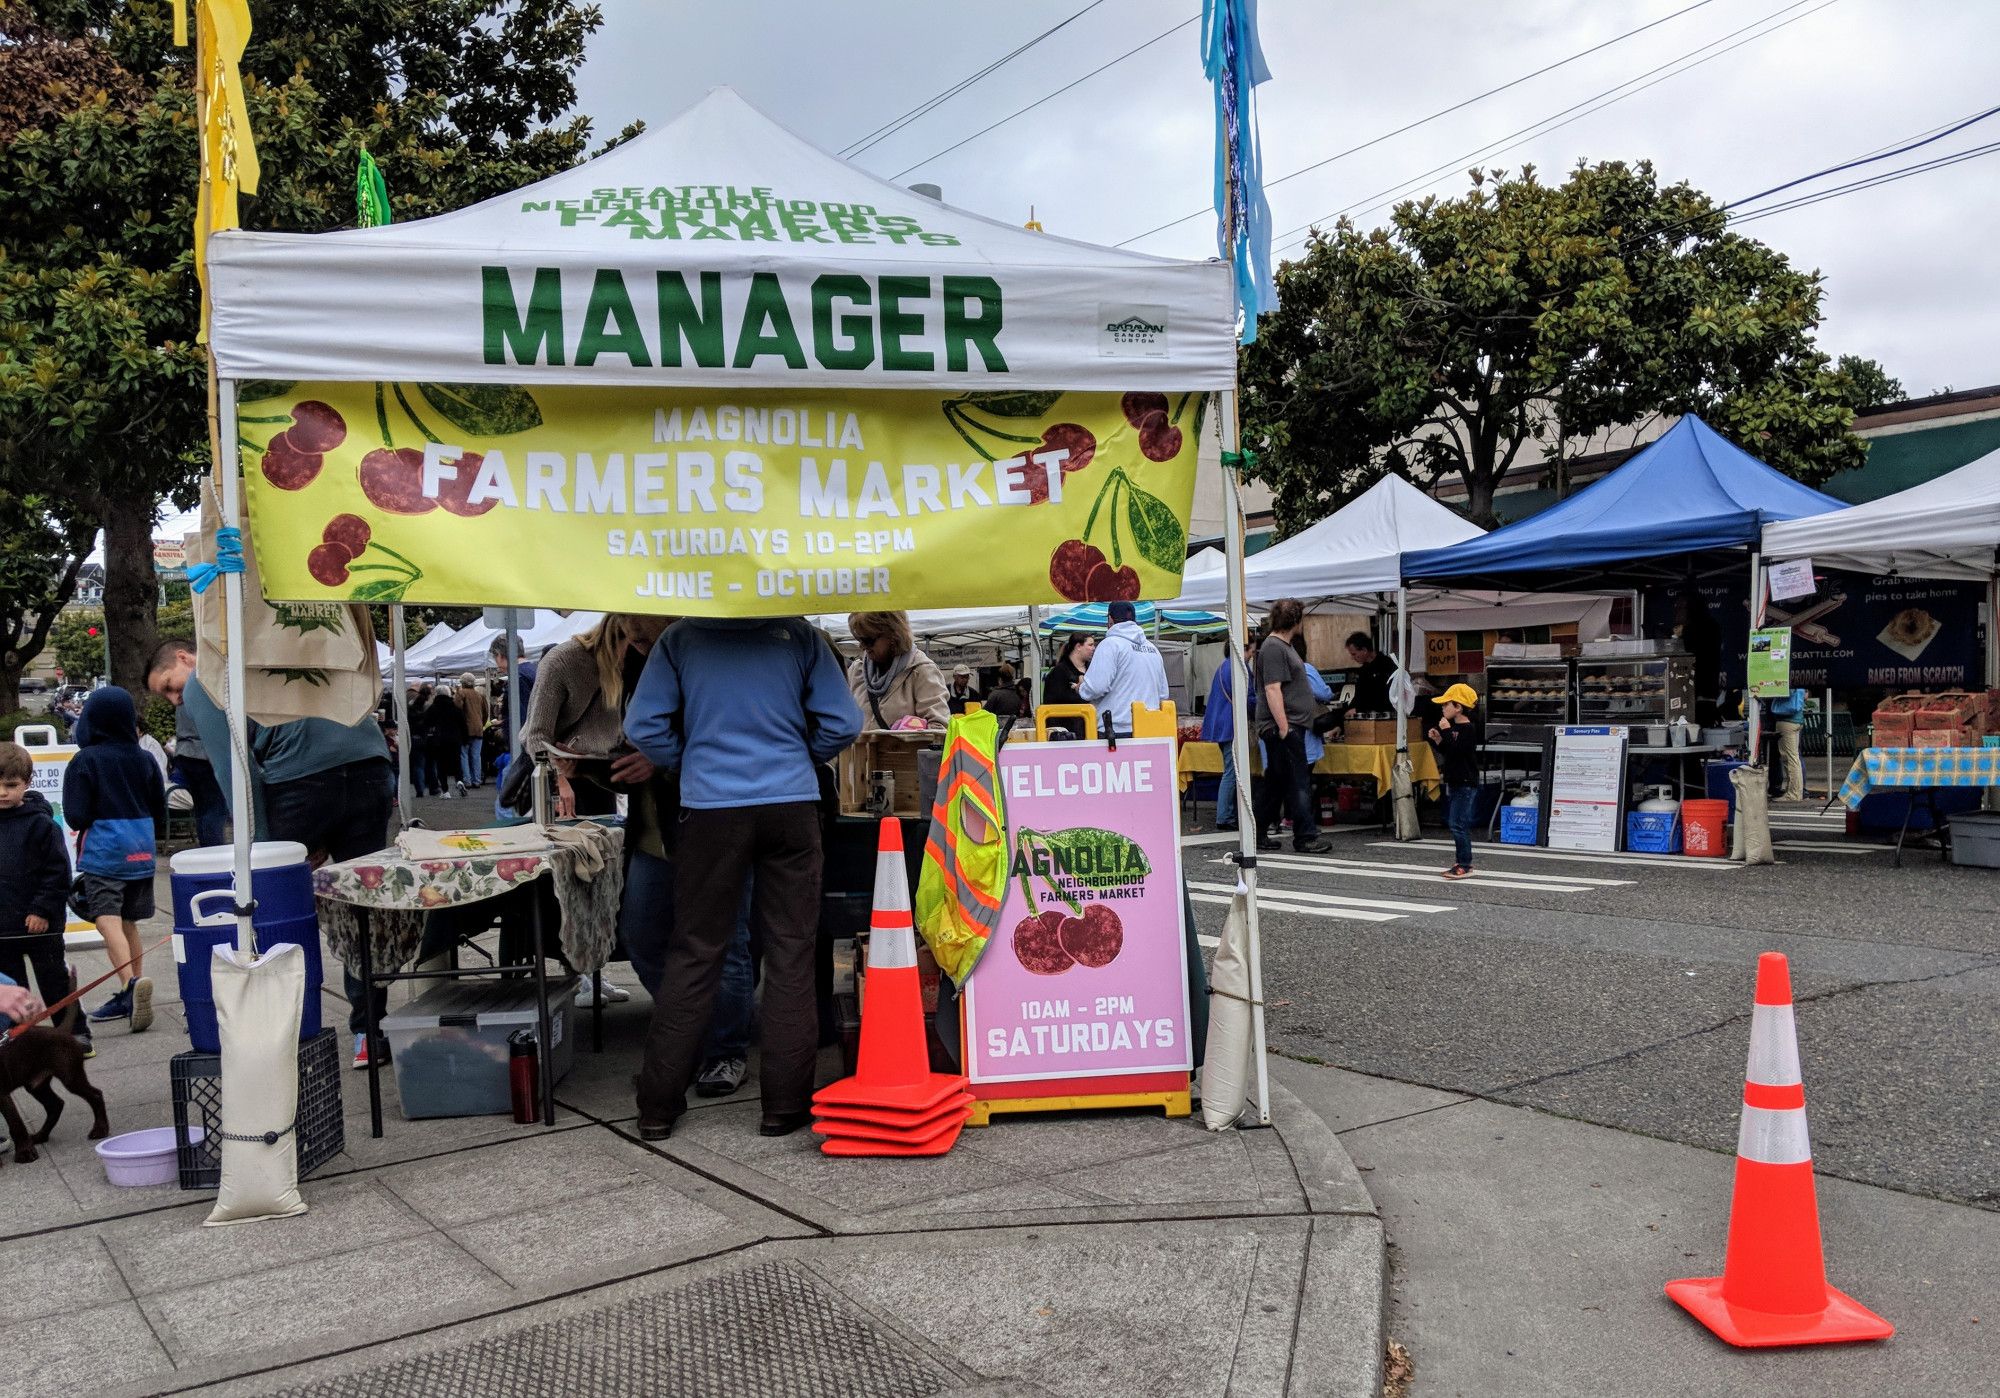
Photo courtesy of pinterest.com
Phinney
A popular gathering spot for both the Phinney Ridge and Greenwood communities, this market is right next door to a playground and offers live music in addition to the great mix of fresh produce and prepared food.
Fridays, 3pm – 7pm | June 2 – Sept 29, 2023
6761 Phinney Ave N | Seattle
seattlefarmersmarkets.org/pfm
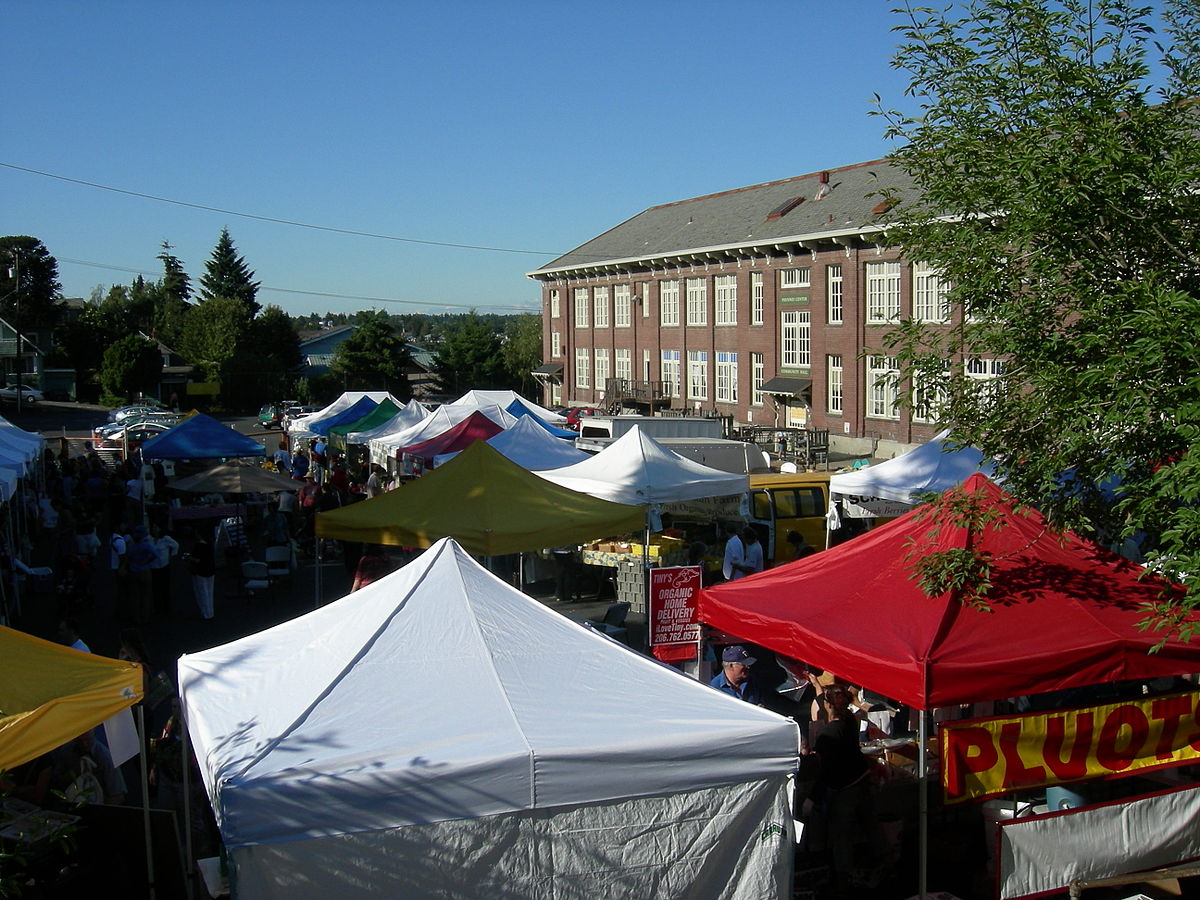
Photo courtesy of wikipedia.org
Pike Place
No introduction needed…make it a day with great restaurants, eateries and retail shops, too.
Daily, 9am – 6pm | Year-Round (Closed Thanksgiving & Christmas)
Pike Place between Pine & Virginia St | Seattle
(206) 682-7453
pikeplacemarket.org
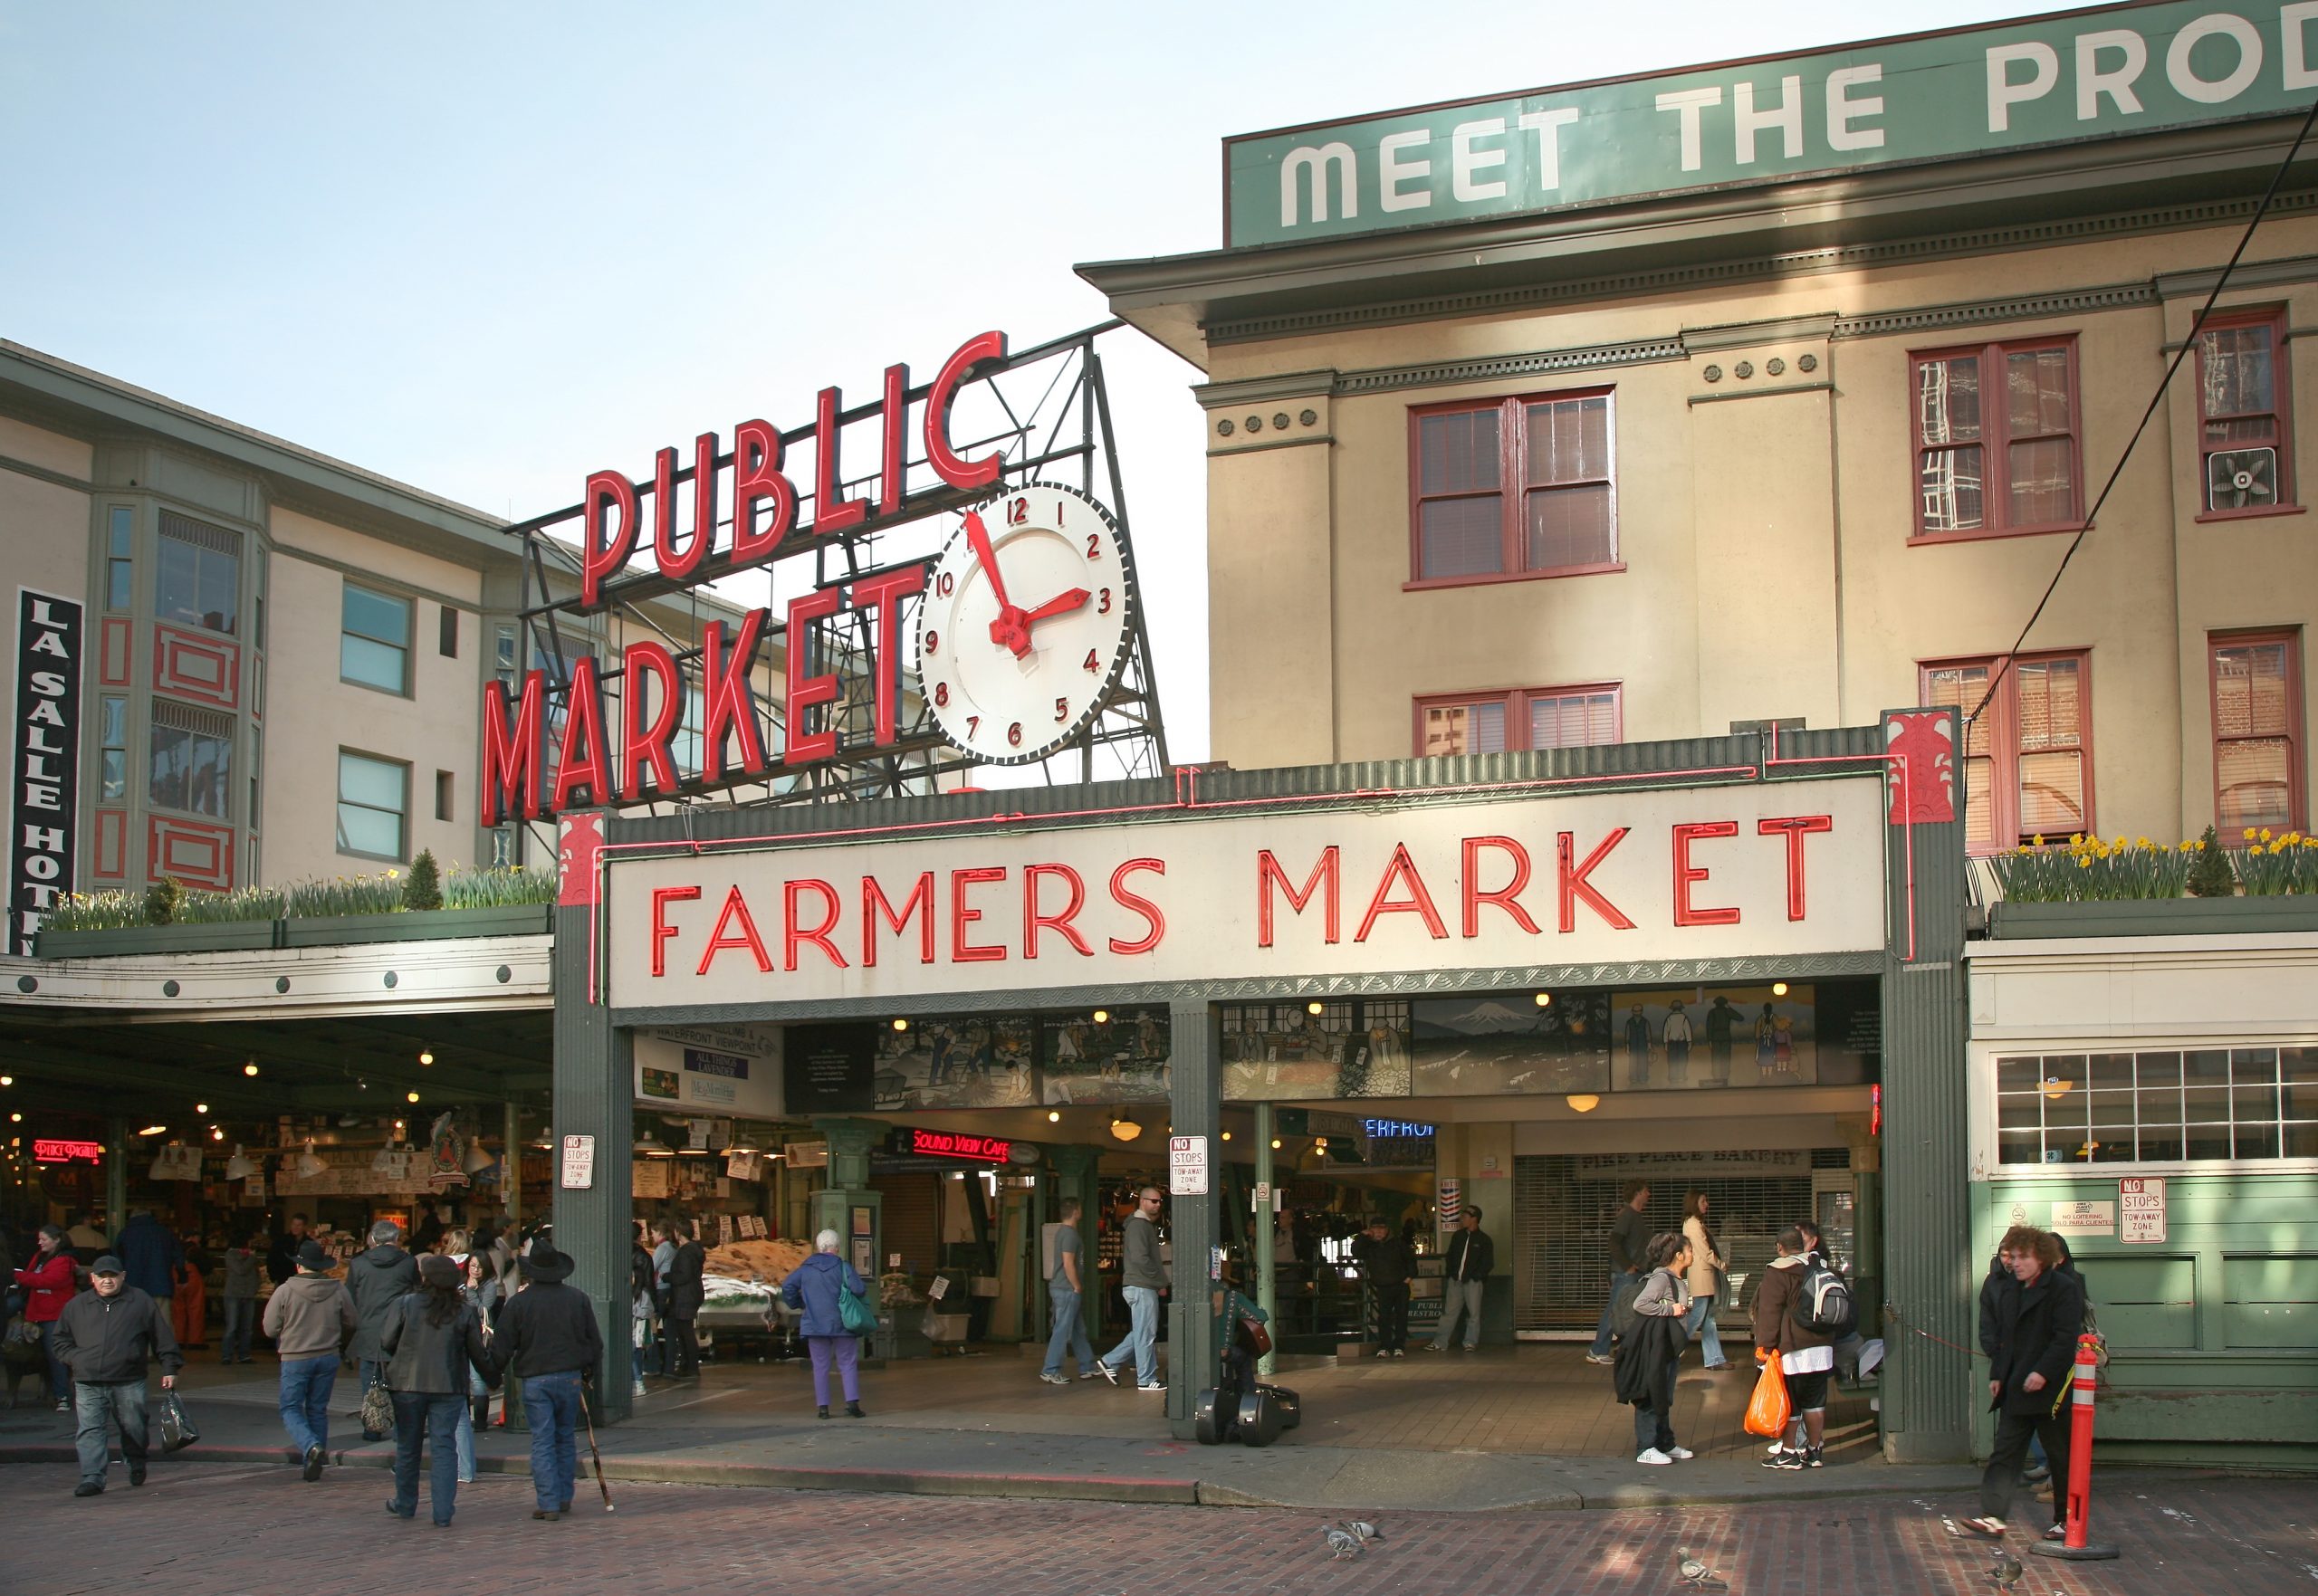
Photo by Daniel Schwen
Queen Anne
Seattle’s only independent farmers market, offering food, chef demos, live music, and children’s activities.
Thursdays, 3pm – 7:30pm | June 1 – Oct 12, 2023 + Harvest Markets on 10/28, 11/18 & 12/16
Queen Anne Ave N & W Crockett St | Seattle
qafm.org

Photo courtesy of qafm.org
Shoreline
Starting this year in their NEW location at the Shoreline Park & Ride, this market offers kids’ programs and live music in addition to its fresh Washington produce, organic meats, bread, honey, and prepared foods. Check out the schedule for info about vendors and entertainment.
Saturdays, 10am – 2pm | June 3 – Oct 7, 2023 + Harvest Markets on 10/28 & 12/16
18821 Aurora Ave N | Shoreline
shorelinefarmersmarket.org
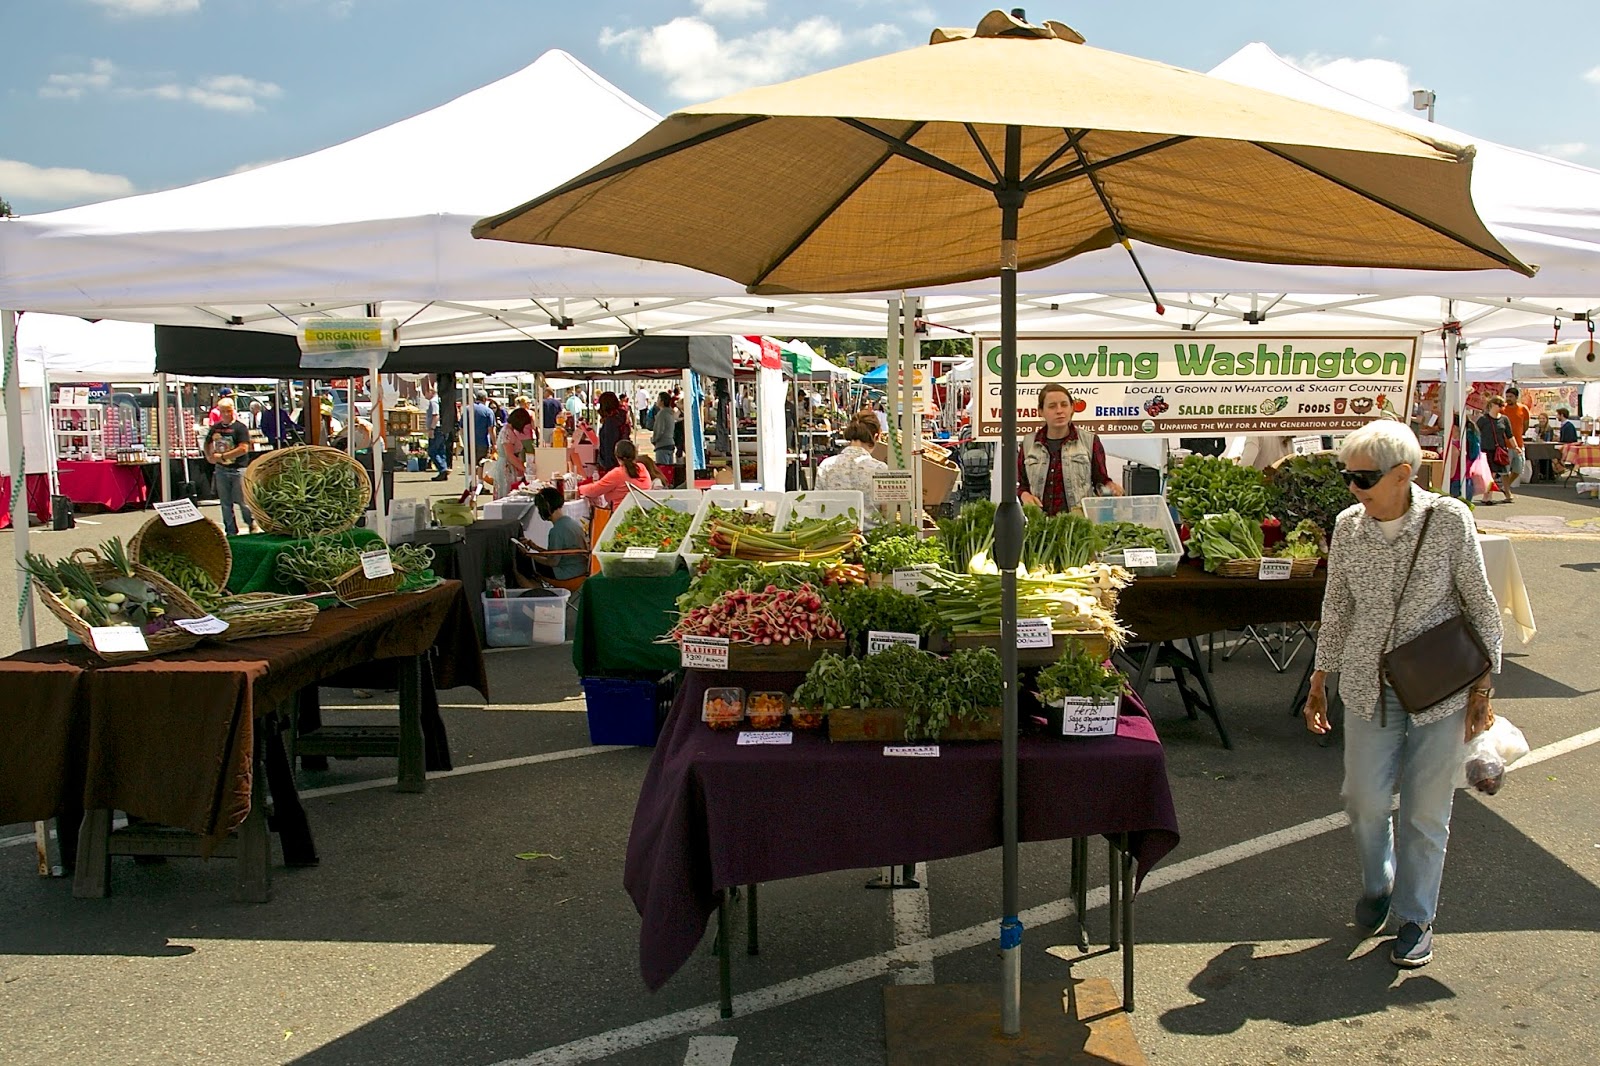
Photo courtesy of www.shorelineareanews.com
University District
Seattle’s only independent farmers market, offering food, chef demos, live music, and children’s activities.
Saturdays, 9am – 2pm | Year-Round
University Way NE (the “Ave”) between 50th & 52nd | Seattle
seattlefarmersmarkets.org/udfm

Photo courtesy of pinterest.com
Wallingford
Located in Meridian Park, you can shop with the whole fam and then enjoy a picnic or playtime at the award-winning playground.
Wednesdays, 3pm – 7pm | May 24 – Sept 27, 2023
4800 Meridian Ave N | Seattle
sfmamarkets.com/visit-wallingford-farmers-market/
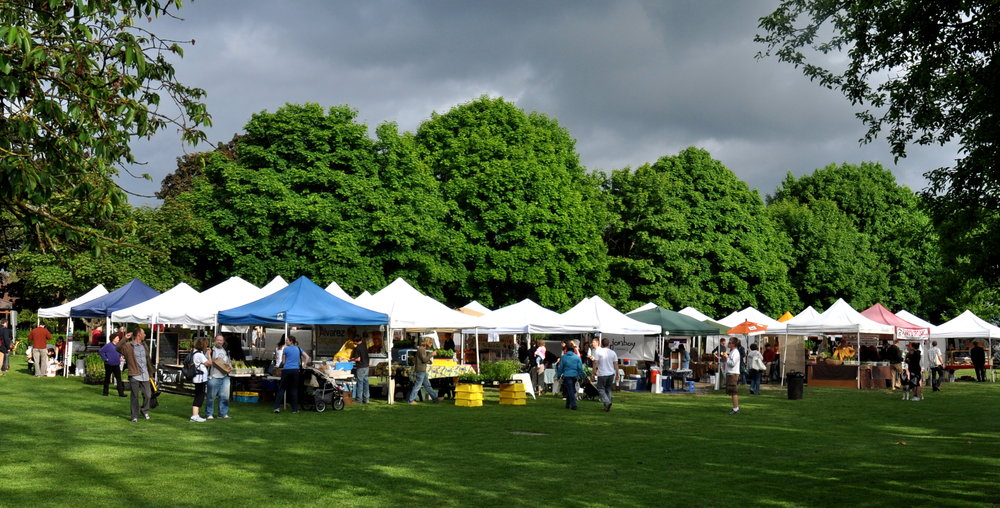
Photo courtesy of sfmamarkets.com
West Seattle
A South Seattle weekend destination, this market is set in the vibrant West Seattle Junction and features up to 70 vendors during the summertime peak. Great community atmosphere celebrating Washington grown food and ingredients.
Sundays, 10am – 2pm | Year-Round
California Ave SW & SW Alaska | Seattle
seattlefarmersmarkets.org/wsfm
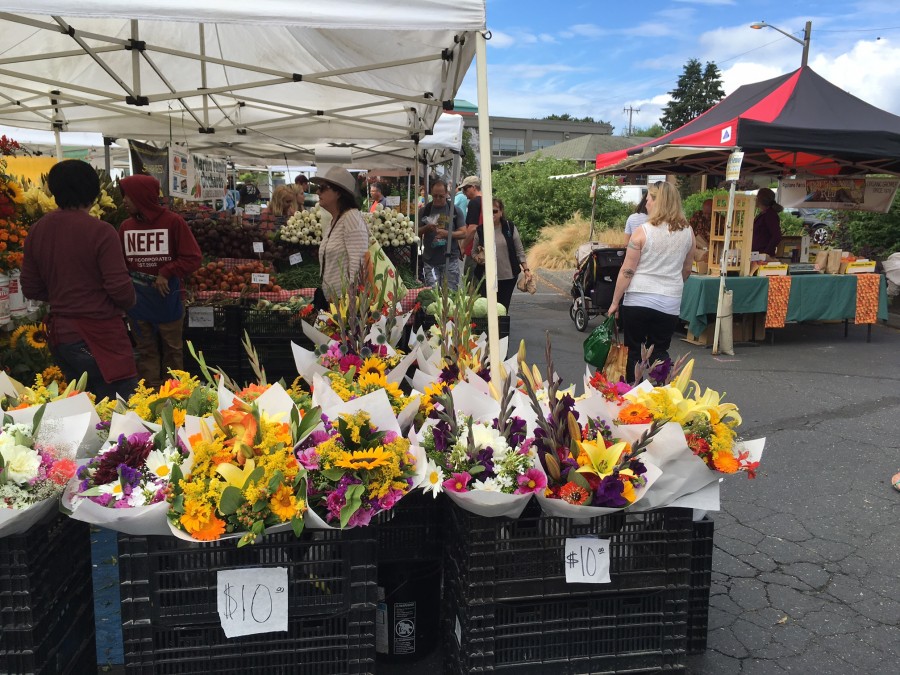
Photo courtesy of westseattleblog.com
Greater Eastside
Bellevue – Crossroads
East Bellevue’s market features fruits, veggies & dairy products from Washington state farms along with handmade soaps, candles, greeting cards, herbal wellness products, and more. Don’t missed the locally roasted coffee and handmade ice cream sandwiches, too!
Tuesdays, 12pm – 6pm | June 6 – Sept 26, 2023
15600 NE 8th St | Bellevue
https://crossroadsbellevue.com/music-events/crossroads-farmers-market/
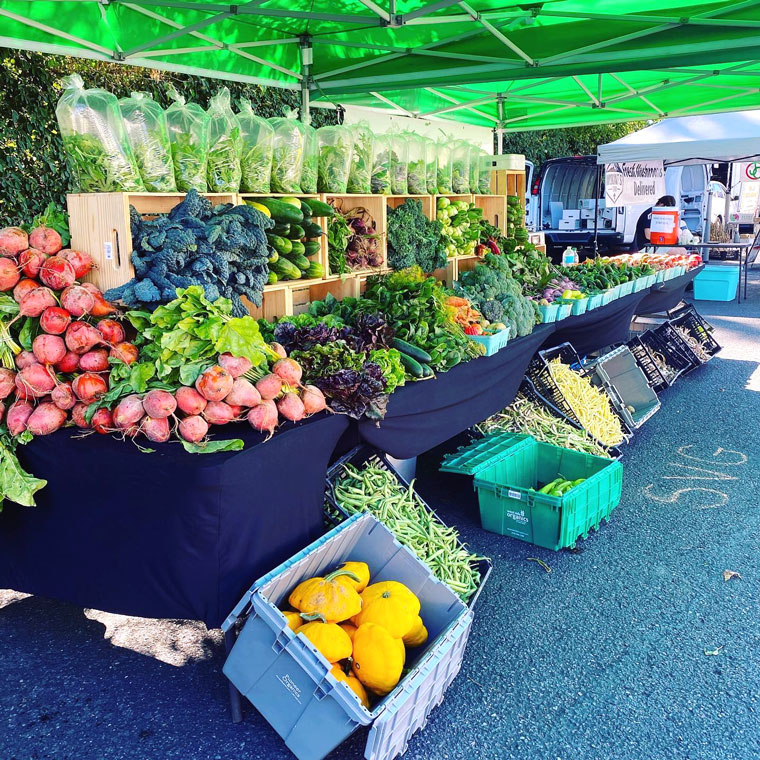
Photo courtesy of crossroadsbellevue.com
Bellevue – Downtown
Set in the heart of Downtown Bellevue, this market offers goods exclusively produced within Washington state—from seasonal fruits & veggies to flowers, fresh meats, artisan goods, and prepared cuisine. The Kids’ POP club empowers kids to know where their food comes from and make healthy eating choices.
Thursdays, 3pm – 7pm | May 18 – Oct 19, 2023
1717 Bellevue Way NE | Bellevue
Spring District: First Wednesday of the month, May – October
12167 NE 14th Terrace | Bellevue
bellevuefarmersmarket.org
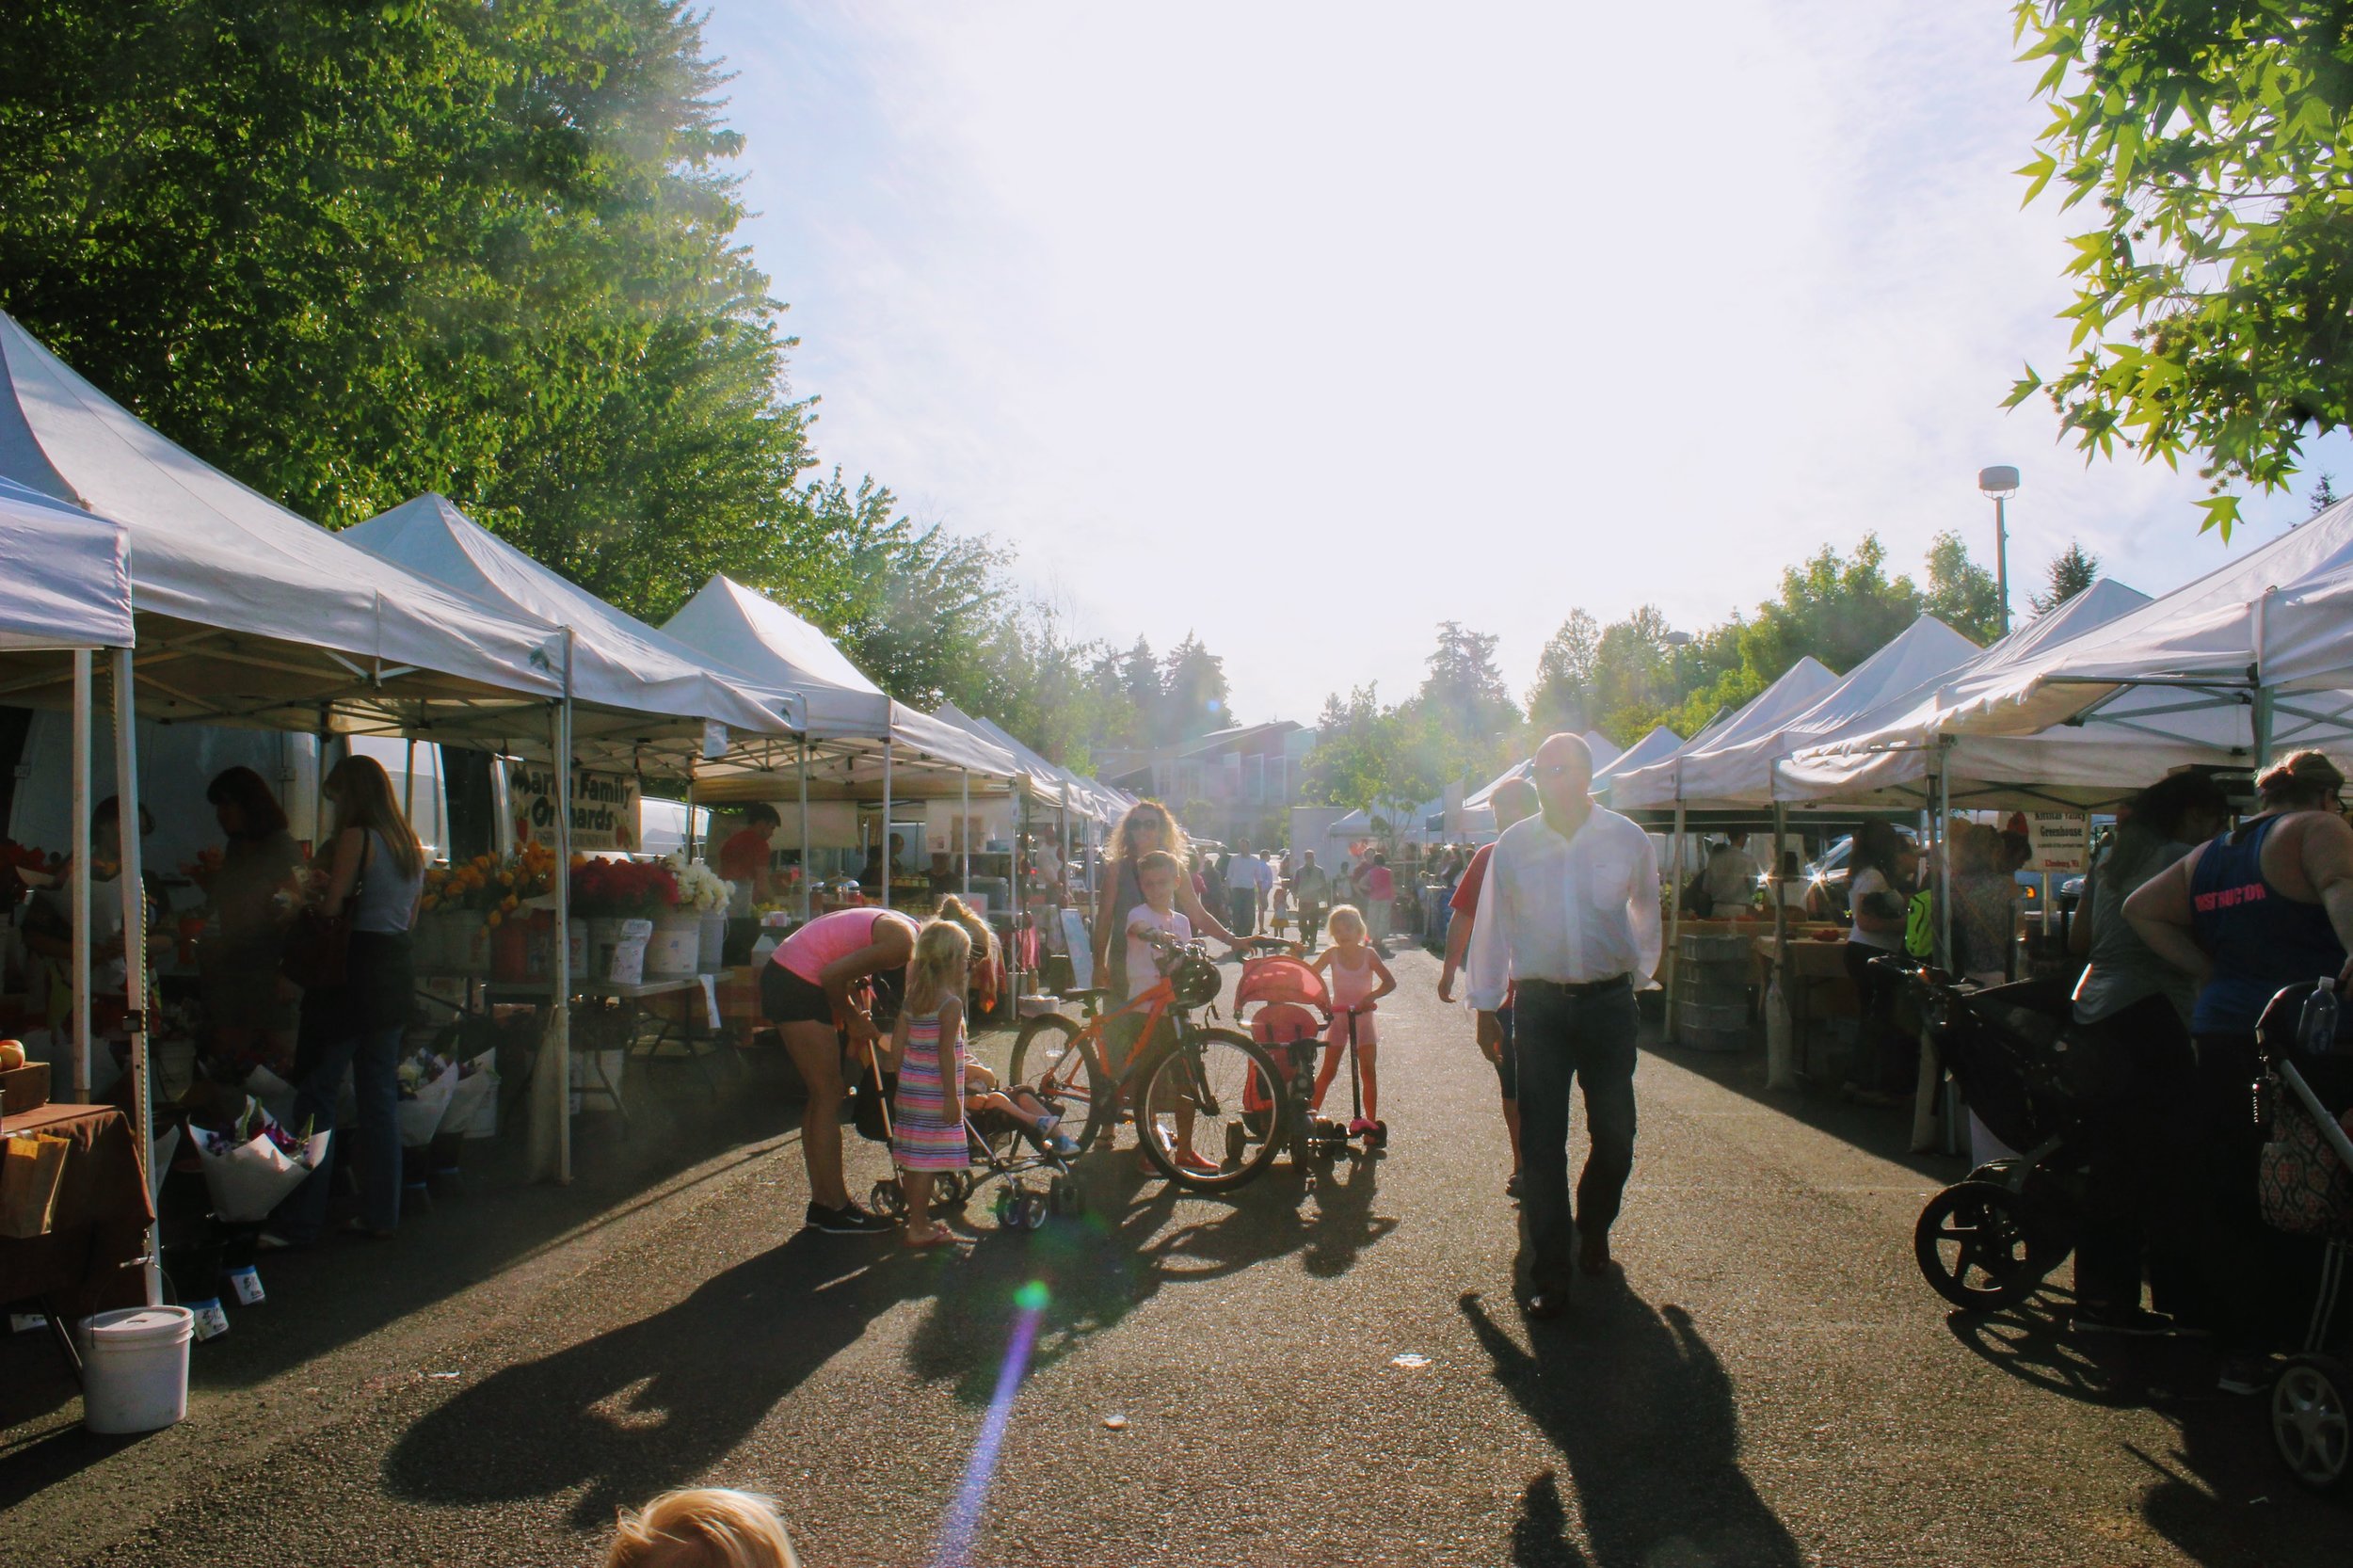
Photo courtesy of eatbellevue.com
Carnation
Set in the heart of the Sno-Valley farming district, you’ll find plenty of freshly picked produce along with live music and educational activities for the kids.
Tuesdays, 3pm – 7pm | June, July & August 2023 (closed July 4th)
Tolt-MacDonald Park, 31020 NE 40th St | Carnation
Map
carnationfarmersmarket.org
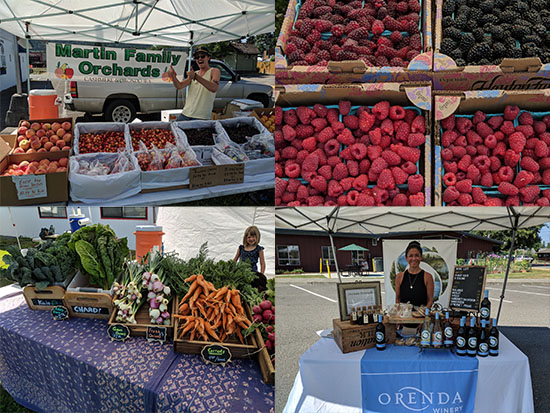
Photo courtesy of carnationfarmersmarket.org
Duvall
Nestled alongside the scenic Snoqualmie River, this friendly market features local eggs, jams, fresh roasted coffee, arts, crafts, and baked goods in addition to the seasonal veggies, fruits, and plant starts. Live music, picnic shelters and a playground make this a fun family destination.
Thursday, 3pm – 7pm | May 4 – October 12, 2023
Taylor Landing at 16201 Main St NE | Duvall
duvallfarmersmarket.org
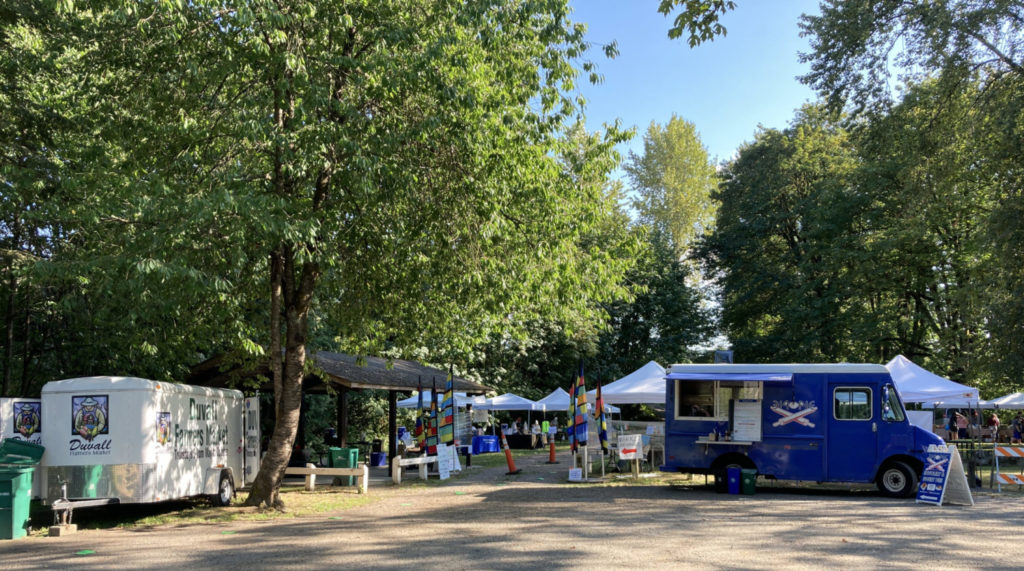
Photo courtesy of duvallfarmersmarket.org
Issaquah
Located at the historic Pickering Barn, this picturesque venue offers a variety of fresh farm and food-based products, concessions, and local artisans.
Saturdays, 9am – 2pm | May 6 – Sept 30, 2023
Pickering Barn, 1730 10th Ave NW | Issaquah
www.issaquahwa.gov/778/Farmers-Market
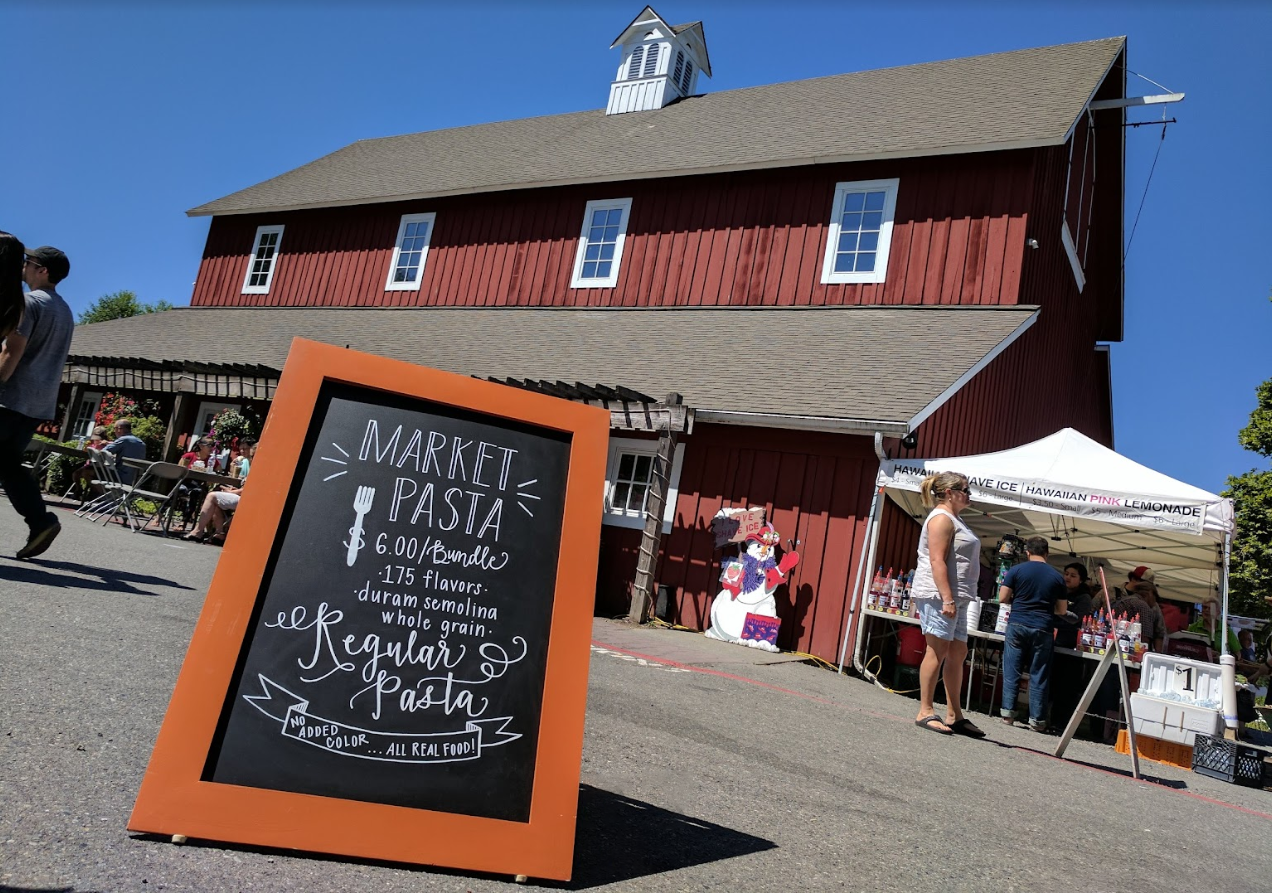
Photo by Saifu Angto, courtesy of google.com
Kirkland – Downtown
This stunning setting on the Lake Washington shoreline turns shopping into a day at the beach. Peruse local produce and goods, then go for a swim or stroll along Moss Bay. Perfect for a picnic, too!
Wednesdays, 3pm – 7pm | June 7 – September 27, 2023
Marina Park, 25 Lakeshore Plaza | Kirkland
kirklandmarket.org
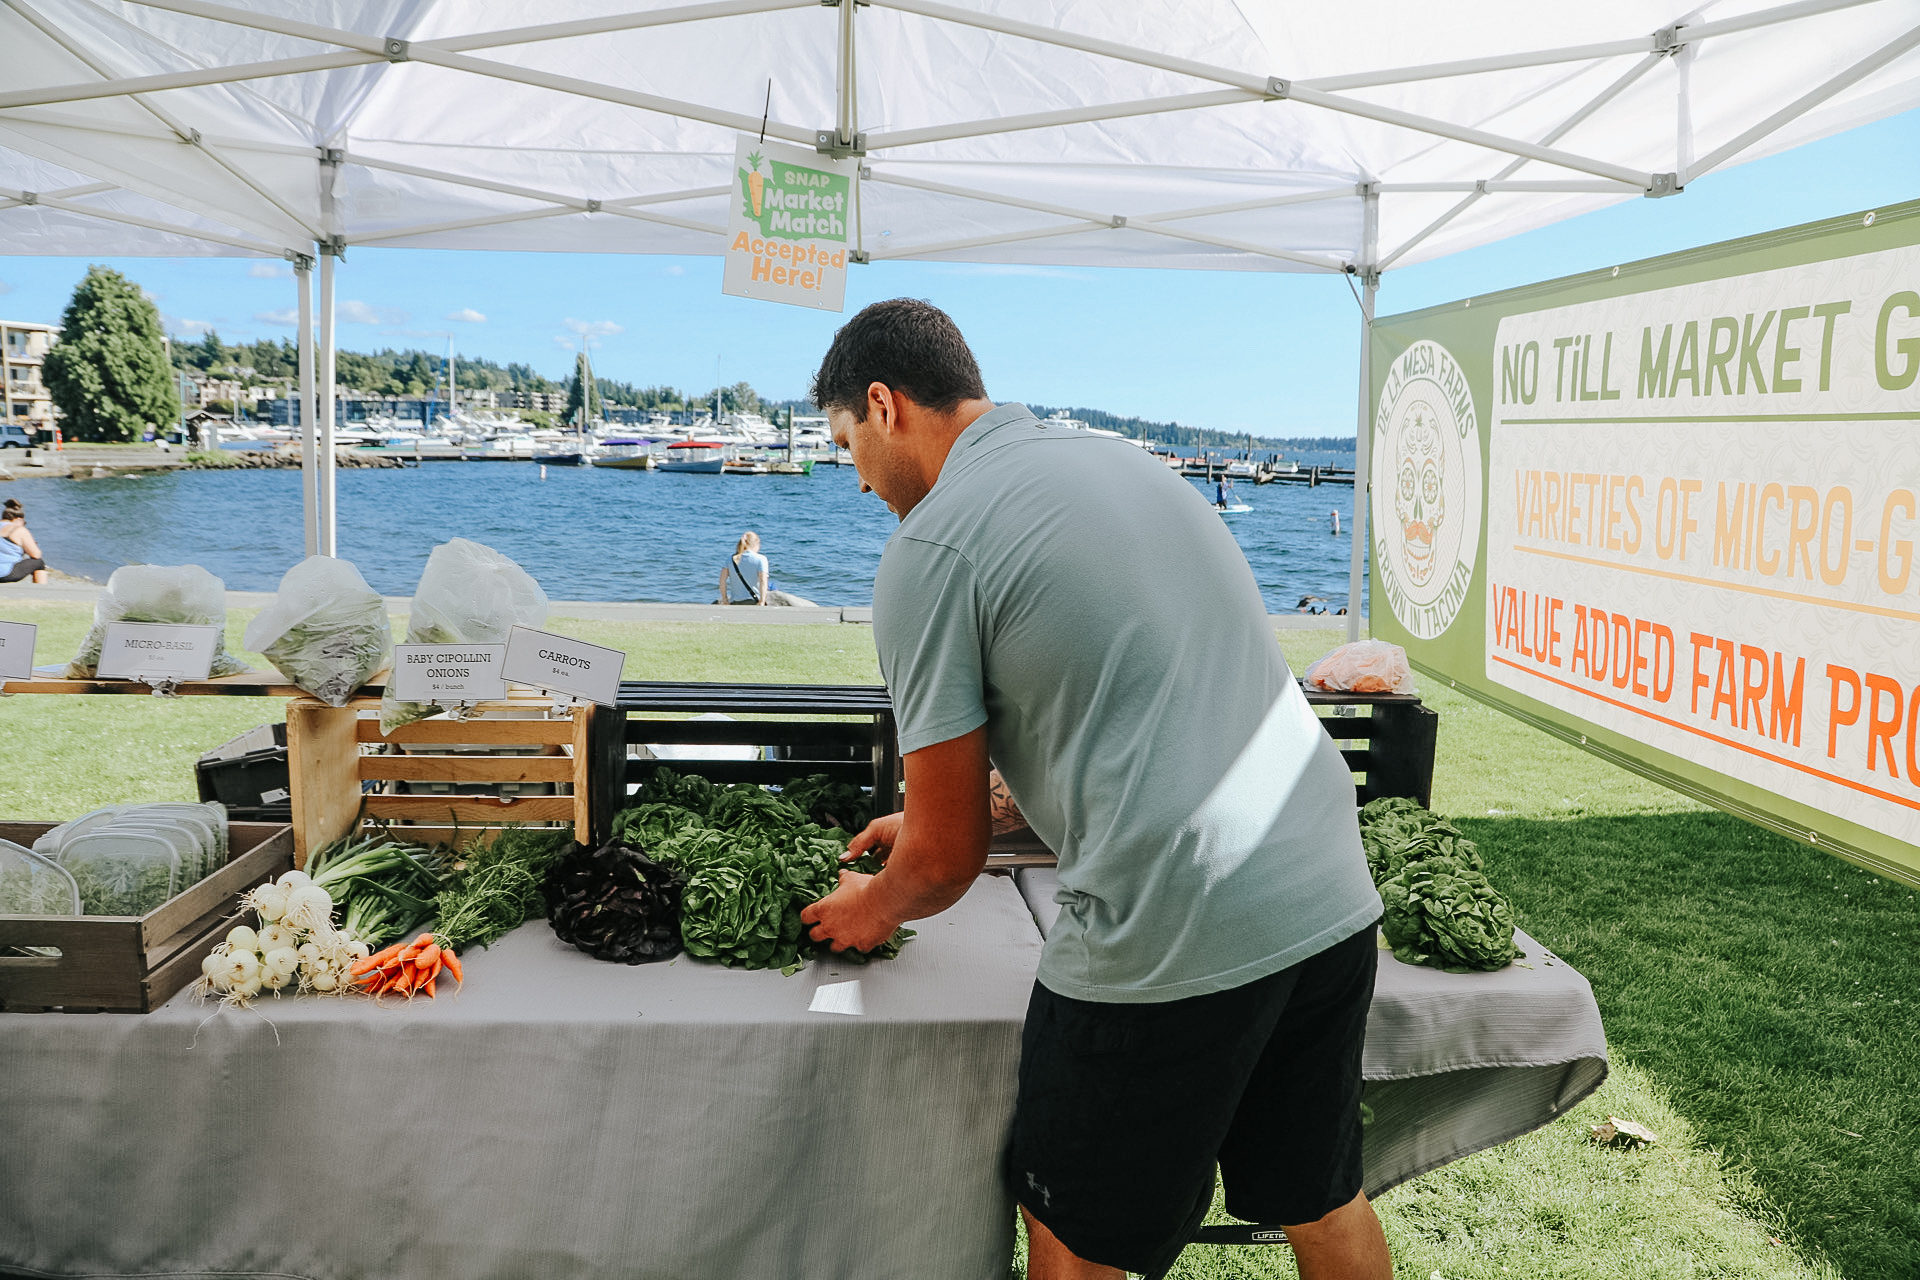
Photo courtesy of kirklandmarket.org
Kirkland – Juanita
Set in beautiful Juanita Beach Park on Lake Washington, you’ll find as many as 30 vendors offering farm fresh local produce, herbs, honey, nuts, flowers, plants, baked good, handcrafted items, and prepared cuisine. Make it a date with live music and a picnic at the beach. There’s a great playground for the kids, too.
Fridays, 3pm – 7pm | June – Sept, 2023
Juanita Beach Park, 9703 NE Juanita Dr | Kirkland
www.kirklandwa.gov
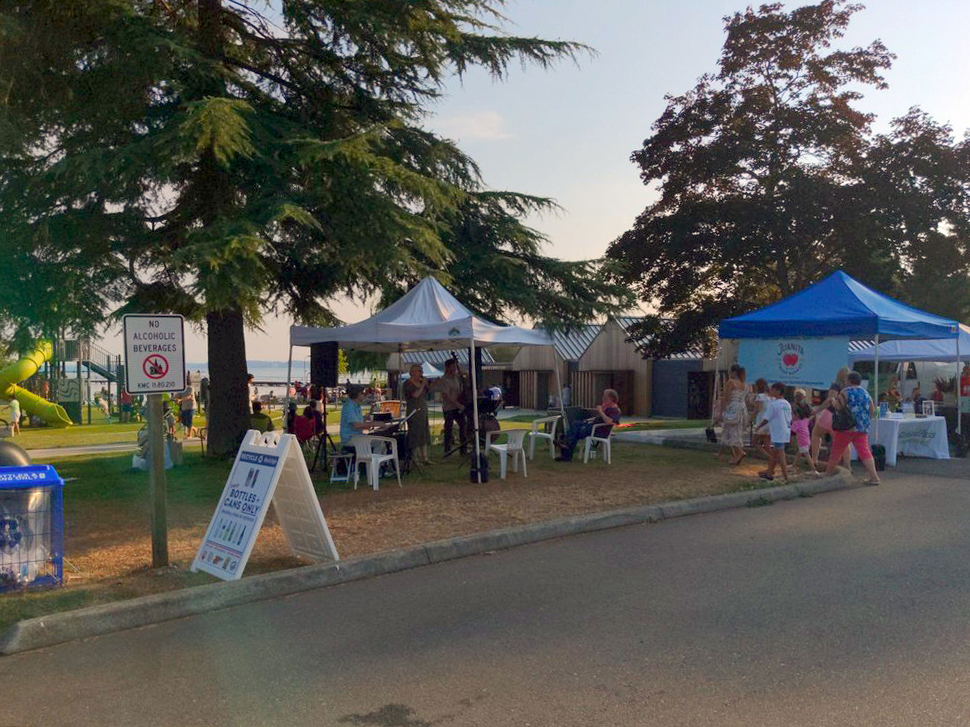
Photo courtesy of yelp.com
Mercer Island
Come on down for quality local Washington state produce, cheese, fish, meat, bread, and more. Check out the live music schedule, too!
Sundays, 10am – 2pm | June 4 – Oct 8, 2023
7700 SE 32nd St | Mercer Island
www.mifarmersmarket.org
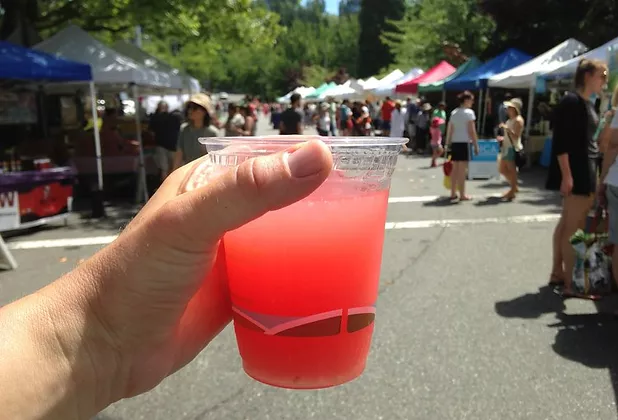
Photo courtesy of www.mifarmersmarket.org
North Bend
This relaxed market enjoys live music and a spectacular Mount Si view. Vendors offer fresh produce, berries, honey, flowers, baked goods, hand-crafted items, and delicious prepared foods. Two playgrounds plus play fields and a covered picnic shelter make this a fun hangout spot. Leashed pets are welcome, too!
Thursdays, 4pm – 8pm | June 8 – Sept 7, 2023
Si View Park, 400 SE Orchard Dr | North Bend
www.siviewpark.org/farmers-market.phtml
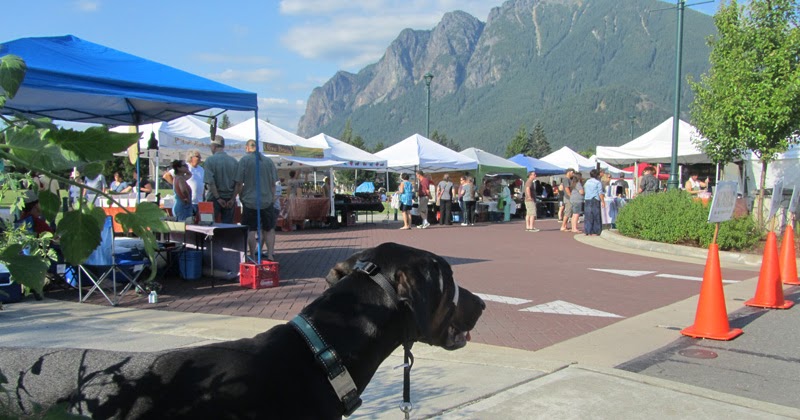
Photo courtesy of thequiltingdoberman.blogspot.com
Redmond
Going strong since 1976, the Redmond Saturday Market offers a huge selection of vendors and dazzling array of produce, flowers, cheeses, preserves, salmon, tea, and handmade goods such as pottery and soaps. You’ll love the ready-to-eat foods, too.
Saturdays, 9am – 2pm | May 13 – Oct 28, 2023
9900 Willows Rd | Redmond
www.redmondsaturdaymarket.org

Photo by Jeff, courtesy of google.com
Renton
Find exclusively Washington-produced fruits, veggies, handmade goods, arts, crafts and more right in the heart of downtown Renton at Piazza Park. Food trucks, live music, and kids’ activities such as the “Healthy Kids Corner” make this a fun spot to liven up your Tuesday.
Tuesdays, 3pm – 7pm | June – Sept, 2023
Piazza Park, 233 Burnett Ave. S | Renton
www.rentonfarmersmarket.com
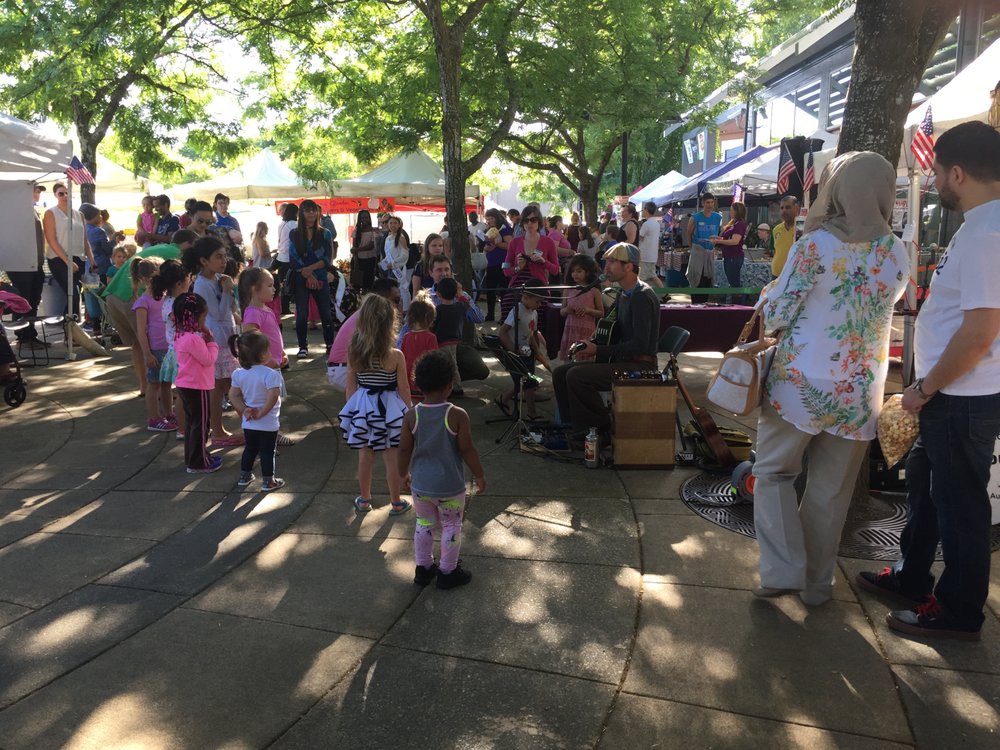
Photo courtesy of yelp.com
Sammamish
Each Wednesday, the Sammamish Commons plays host to a variety of local farmers, nurseries, bakeries, artisans, food vendors, and more. Live music and kids’ activities, too!
Wednesdays, 4pm – 8pm | May – Sept, 2023
Sammamish Commons, 801 228 Ave SE | Sammamish
www.sammamishfarmersmarket.org
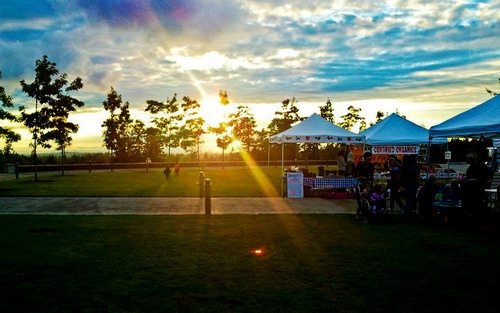
Photo courtesy of sammamishfarmersmarket.org
Woodinville
Come check out downtown Woodinville’s newly renovated Schoolhouse District and find produce grown in the state of Washington (and picked fresh for that morning!). You’ll also have an array of boutique baked goods, sauces, cider, artisans, and more to peruse. Check out the calendar for live entertainment, music, demos, and other activities.
Saturdays, 10am – 3pm | May – Sept, 2023
13205 NE 175th St | Woodinville
woodinvillefarmersmarket.com

Photo courtesy of woodinvillefarmersmarket.com

© Copyright 2022-2023, Windermere Real Estate/Mercer Island.
Favorite Summer Festivals

The sun is here and the whole PNW is celebrating! Whether it’s a fair close to home or an excuse to pack up the fam for a destination festival, I hope you get out and make the most of these fun events…
JUNE
JULY
- Seafair Summer 4th (7/4)
- Redmond Derby Days (7/14-7/15)
- Ballard Seafood Fest (7/14-7/16)
- Kirkland Uncorked (7/14-7/16)
- West Seattle Summer Fest (7/14-7/16)
- Mercer Island Summer Celebration (7/15)
- Renton River Days (7/21-7/23)
- Bite of Seattle (7/21-7/23)
- Sequim Lavender Weekend (7/21-7/23)
- Timber! Outdoor Music Festival (7/27-7/29)
- Bellevue Arts & Crafts Fair (7/28-7/30)
AUGUST
- Seafair Weekend (8/4-8/6)
- Watershed at the Gorge (8/4-8/6)
- Festival at Mount Si (8/12-8/13)
- Chief Seattle Days (8/18-8/20)
- CHOMP Redmond Food Festival (8/19)
- Evergreen State Fair (8/24-9/4)
- Port Townsend THING Music/Art Festival (8/25-8/27)
SEPTEMBER
- Washington State (Puyallup) Fair (9/1-9/24)
- Bumbershoot (9/2-9/3)
- Mercer Island Art UnCorked (9/8)
- Fremont Oktoberfest (9/22-9/24)
JUNE
Fremont Fair
One of Seattle’s biggest events, this bohemian-inspired festival features 300+ craft vendors, food, beer garden, dog parade, music, and the Solstice Parade (including the unofficial but famous naked bide ride).
Saturday, June 17 & Sunday, June 18, 2023
West of Fremont Ave N, on N 35th St. and N 34th St.

Photo courtesy of fremontfair.com
Seattle PrideFest
Held in two locations (Capitol Hill & Seattle Center) this year with beer gardens, food, performances, and dancing in the Seattle Center fountain.
Saturday, June 24th – Capitol Hill
310 Broadway E | Seattle
Sunday, June 25th – Seattle Center
305 Harrison St | Seattle

Photo courtesy of seattlepridefest.org
JULY
SeaFair Summer Fourth
Seattle’s biggest fireworks show plus live music, family activities & beer gardens. Watch the show from free open seating or reserve a front row seat.
Tuesday, July 4th, 2023
Gates Open at 3pm, Fireworks at 10:15pm

Photo courtesy of seafair.org/summerfourth
Redmond Derby Days
Redmond’s bike-themed summer event including bicycle races, kids bike parade, carnival rides, drone light show, craft fair, arts festival, food, cornhole tourney, and live music.
Friday, July 14th & Saturday, July 15th, 2023
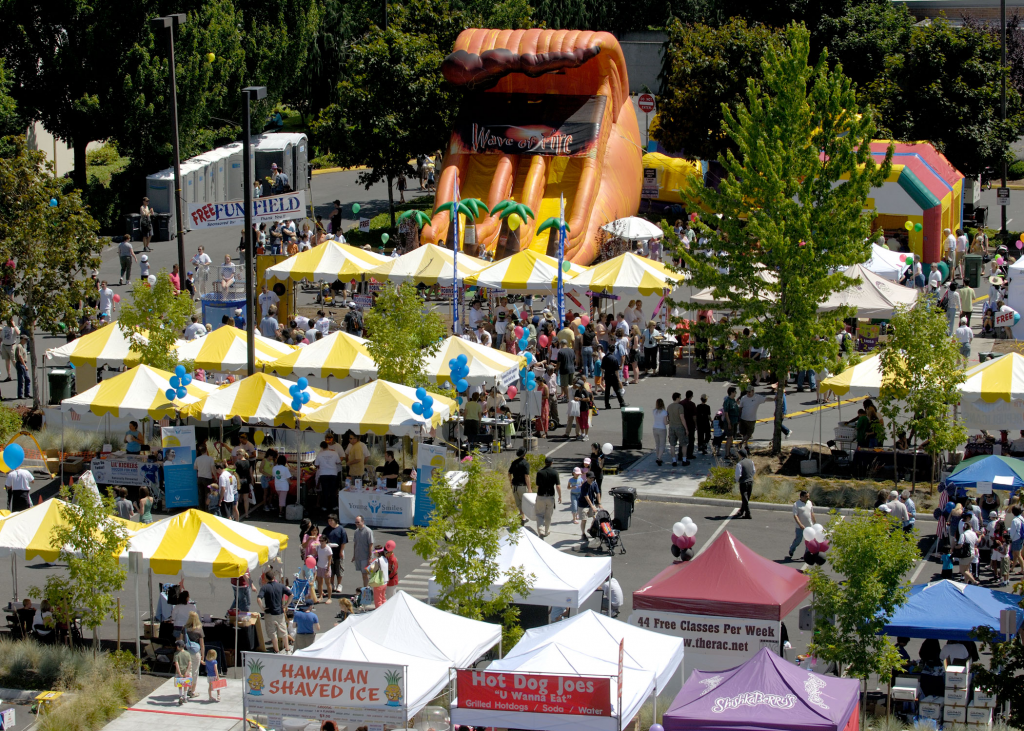
Photo courtesy of redmond.gov
Ballard Seafood Fest
Live music, salmon BBQ, kids entertainment, vendors, and excellent craft beer. Don’t miss the Festi-Bowl skateboard events at Ballard Commons Park on Saturday, the 15th.
Friday, July 14th – Sunday, July 16th, 2023
2208 NW Market St | Seattle (on Market St from Leary to 24th Ave NW, and on Ballard Ave from Market St to 22nd Ave NW)

Photo courtesy of Andrew Jacob Media and seafoodfest.org
Kirkland Uncorked
Sip local wine, beer or cocktails and listen to live music in beautiful Marina Park on the water. There’s also a street fair with crafts, art, food, dog modeling contest (!), and more. Buy tickets here (proceeds benefit the Homeward Pet Adoption Center).
Friday, July 14th – Sunday, July 16th, 2023

Photo courtesy of kirklanduncorked.com
West Seattle Summer Fest
Live bands, arts & crafts booths, outdoor cafes, beer garden, and fun Kids Zone with inflatables.
Friday, July 14th – Sunday, July 16th, 2023
The Junction, 4210 SW Oregon St | Seattle
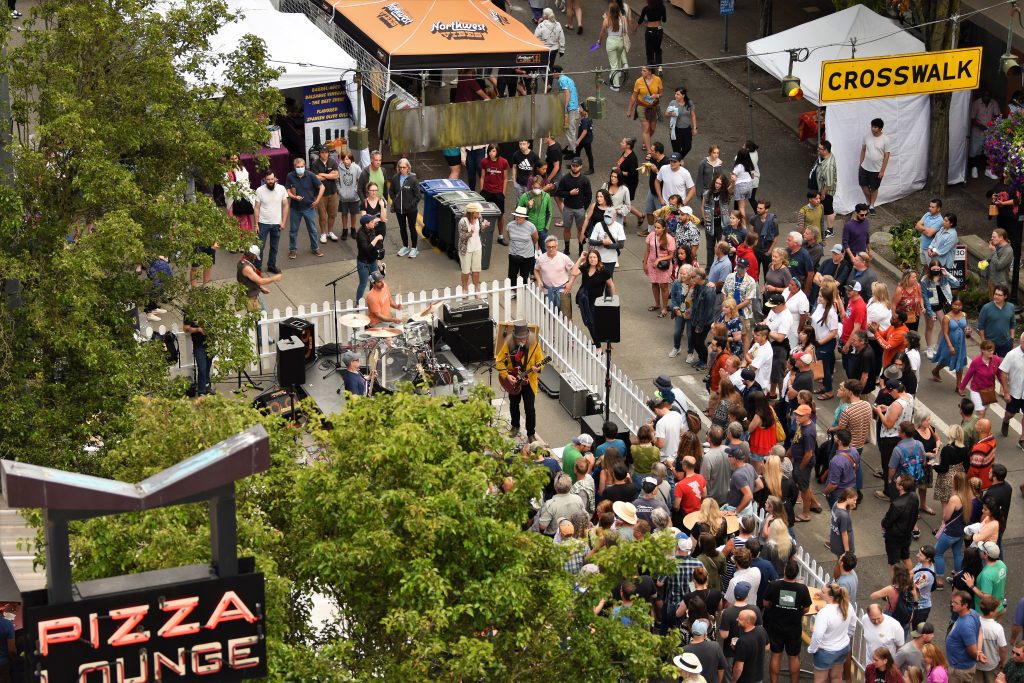
Photo courtesy of westseattlesummerfest.com
Mercer Island Summer Celebration
Parade and lively street fair at Mercerdale Park followed by a waterfront fireworks show at Luther Burbank Park.
Saturday, July 15th, 2023
Fireworks at 10pm
Mercerdale Park Fair: 3009 77th Ave SE | Mercer Island
Luther Burbank Park (Fireworks): 2040 84th Ave SE | Mercer Island
mercerisland.gov/summercelebration

Photo courtesy of Mercer Island Parks & Recreation
Renton River Days
Summer bazaar, parade, rubber duck derby, live music, food trucks, beer/wine gardens, activity zone, drone show, volleyball & basketball tourneys, and 5k/10k Fun Walks on the Cedar River Trail.
Friday, July 21st – Sunday, July 23rd, 2023

Photo courtesy of patch.com
Bite of Seattle
200 vendors, 50+ music performances (including Sir Mix-a-Lot!), 3 beer gardens, wine garden, & more.
Friday, July 21st – Sunday, July 23rd, 2023
Seattle Center, 305 Harrison St | Seattle

Photo courtesy of biteofseattle.com
Sequim Lavender Weekend
Celebrate all things lavender with tours of local farms, live music, and 150 street fair booths highlighting NW crafts & food.
Friday, July 21st – Sunday, July 23rd, 2023
Carrie Blake Park, 500 N Blake Ave | Sequim
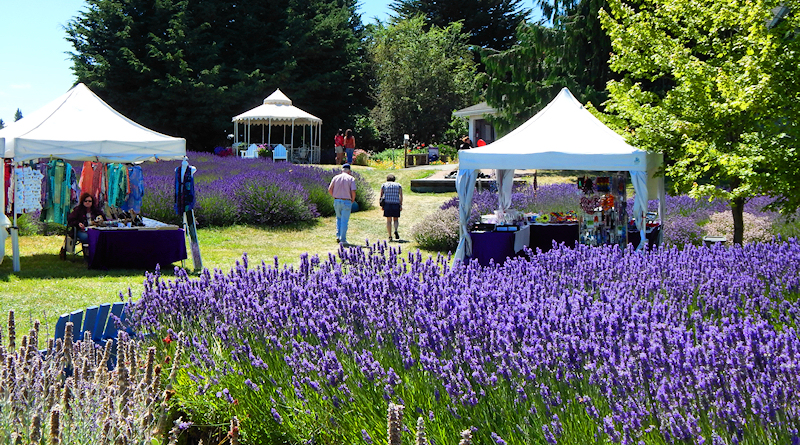
Photo courtesy of seattleandsound.com
Timber! Outdoor Music Festival
In addition to a wide range of local musicians, discover adventures like bat/bird finding expeditions, hiking, biking, tree climbing, nature painting/photography, yoga, 5K run, coffee walk, obstacle course, stargazing, fika (a Swedish morning tradition), shibori shirt dyeing, and lots of kids activities. Enjoy great food & local brews, too.
Thursday, July 27 – Saturday, July 29, 2023
Tolt-MacDonald Park, 31020 NE 40th St | Carnation
Video courtesy of Timber! Outdoor Music Festival
Bellevue Arts Fair
Shop from over 300 artists showcasing their handmade arts & crafts. Kids Fair, food trucks, stage performances, and free Bellevue Art Museum exhibitions, too!
Friday, July 28th – Sunday, July 30th, 2023
Bellevue Square, 510 Bellevue Way NE | Bellevue
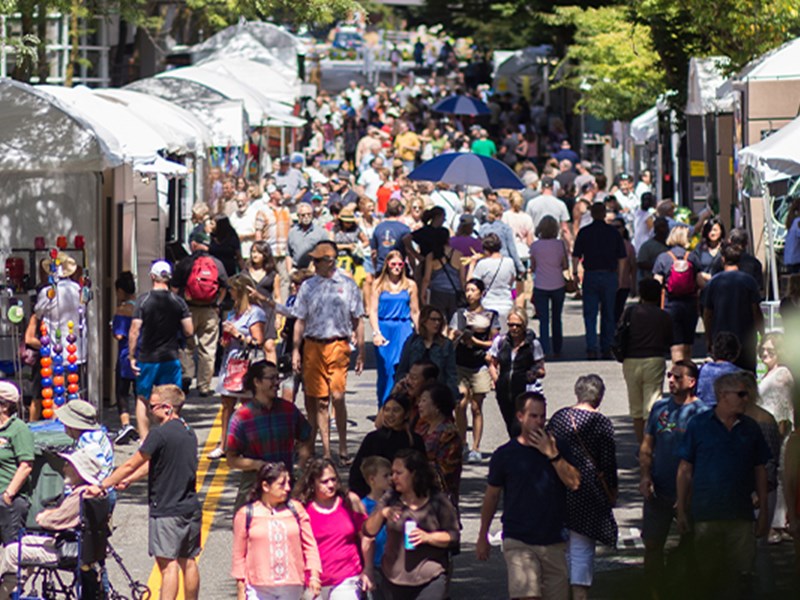
Photo courtesy of bellevuearts.org/artsfair
AUGUST
Seafair Weekend
Seattle’s iconic festival featuring a spectacular airshow, hydroplane races, classic car show, live music, local food/beverages, and log boom party for boaters.
Friday, August 4th – Sunday, August 6th, 2023
Genesee Park, 4316 S Genesee St | Seattle

Photo courtesy of seafair.org
Watershed
If you’re a country music fan, then this destination festival at the Gorge is for you. Three days of live bands plus carnival rides, food, drinks, and camping.
Friday, August 4th – Sunday, August 6th, 2023
The Gorge Ampitheatre, 754 Silica Rd NW | Quincy

Photo courtesy of watershedfest.com
Festival at Mount Si
This street fair in scenic North Bend offers music, a parade, 5K fun run, cherry pie eating contest, and even a live chili cookoff (not to mention food and craft vendors!). Make it a day and visit the outlet mall or go hiking while you’re at it.
Saturday, August 12th & Sunday, August 13th, 2023
Si View Park, 400 SE Orchard Dr | North Bend
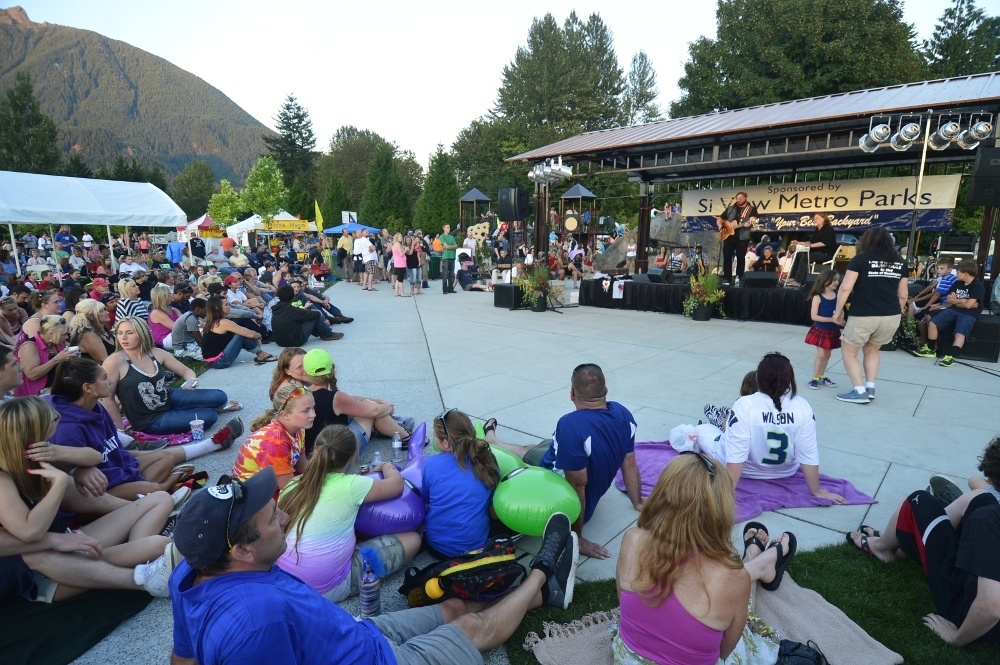
Photo courtesy of festivalatmtsi.org
Chief Seattle Days
A celebration of the Suquamish people honoring Chief Seattle since 1911, this festival is now open to the public and includes canoe races, a salmon bake, 5k fun run, market, games, traditional songs & dances, and a gravesite honoring for Chief Seattle.
Friday, August 18th – Sunday, August 20th, 2023
Gravesite Honoring of Chief Seattle: 7076 NE South St | Suquamish

Photo courtesy of chiefseattledays.org
CHOMP Local Food Festival
A King County celebration of all that is local, sustainable, fresh…and delicious. Spend the day at beautiful Willowmoor Farm in Marymoor Park and support area farms. Live music, local food vendors, all-ages activities, and zucchini races, too!
Saturday, August 19th, 2023 from 10am to 6pm
Marymoor Park, 6046 West Lake Sammamish Pkwy NE | Redmond
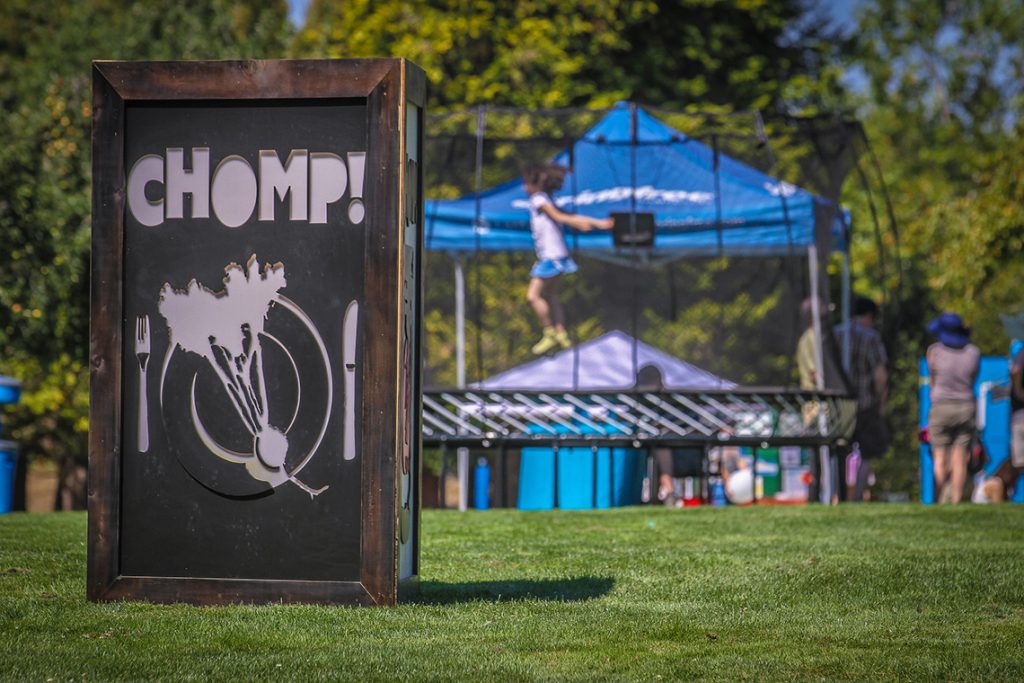
Photo courtesy of chomplocal.org
Evergreen State Fair
Held each year during the 11 days leading up to Labor Day (for the past 114 years!), this fair offers a little of everything—a fun carnival with rides/games, food, shopping, contests, live events, and more.
August 24th – September 4th, 2023
(Closed Wednesday, August 30th)

Photo courtesy of Evergreen State Fair
THING: Music, Arts & Other Things
The ultimate destination festival, this 3-day event takes place amongst scenic sound views at Port Townsend’s historic Fort Worden (it’s even got a lighthouse!). In addition to an epic music lineup, you’ll also find art installations, workshops, and activities for all ages.
Friday, August 25th – Sunday, August 27th, 2023
200 Battery Way | Port Townsend

Photo courtesy of THING
SEPTEMBER
Washington State (Puyallup) Fair
A September tradition, peeps all around the Sound flock to “Do the Puyallup.” You’ll find your favorite carnival rides, a concert series, rodeo, petting farm, and a plethora of exhibits & vendors.
September 1st – 24th, 2023

Photo courtesy of thefair.com
Bumbershoot
Seattle’s biggest music festival and a 50-year tradition. This year you’ll find a great music lineup along with everything art, dance, performances, roller skating, and…a cat circus.
Saturday, September 2nd – Sunday, September 3rd, 2023
Seattle Center, 305 Harrison St | Seattle
Photo courtesy of seattlecenter.com
Mercer Island Art UnCorked
Discover Washington wine, beer & cider while you browse local artists at this outdoor event in Mercer Island’s Greta Hackett Outdoor Sculpture Gallery. Tasting garden, artist booths, live music, food trucks, and more.
Friday, September 8th, 2023 | 5-8 pm
78th Ave SE & Sunset Hwy | Mercer Island
Photo courtesy of mi-reporter.com
Fremont Oktoberfest
Celebrate 100+ beers and ciders along with games, Texas Chainsaw Pumpkin Carving, and Dogtoberfest. Strictly 21+…unless you’re a dog.
Friday, September 22nd – Sunday, September 24th, 2023

Photo courtesy of fremontoktoberfest.com
© Copyright 2023, Windermere Real Estate/Mercer Island.
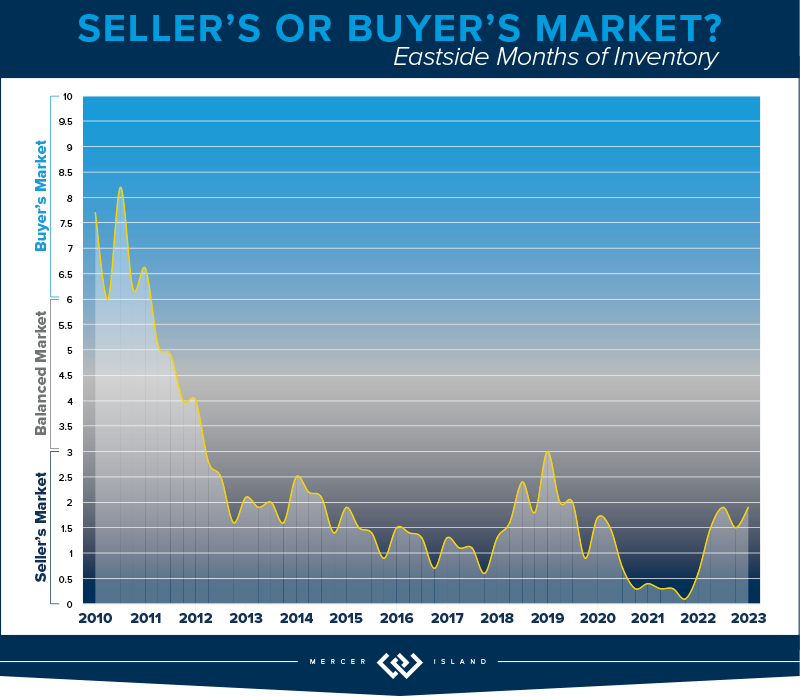
How’s the Market? Q1 2023 Review of Seattle Area Real Estate
The first quarter of 2023 saw a price correction compared to last year’s spike, with year-over-year median prices down by 9% in Seattle and 14% on the Eastside. That being said, prices are already beginning to climb again with steady growth since the beginning of the year. Buyer demand remains strong despite higher interest rates—competitively priced, well-presented homes are still fetching multiple offers.
Click or scroll down to find your area report:
Seattle | Eastside | Mercer Island | Condos | Waterfront
SEATTLE
For those who purchased a home in Seattle this quarter, it likely felt like there were more options and inventory with a minor rebalance on price. While transactions were down 28% year over year, we also saw median sales price was down from $925,000 to $830,000 since last quarter, which is a 9% adjustment. A down correction in pricing gave relief to buyers feeling the pinch and stress of rising interest rates to 6.5%. Rates have doubled the past 1.5 years but, considering the limited supply of homes for sale, the drop in home prices hasn’t been severe.
Neighborhoods like Lake Forest Park saw growth in their number of transactions (up 15%); other neighborhoods like Madison Park and Capitol Hill had nearly half the homes for sale compared to last year. It’s no surprise that as interest rates rise and affordability changes, buyers are casting a wider net to other parts of Seattle to the north. Keep an eye on neighborhoods like Shoreline, Kenmore and Lake Forest Park. Desirable prices paired with accessible transit is a bonus for those who are being asked to return to the office.
Multiple offers are apparent in some neighborhoods (price & presentation is key!) and we did experience 30% of homes sell above their listing price. If the shortage of inventory remains and interest rates drop slightly, we could see the frequency of multiple offers increase.
Click here for the full report and neighborhood-by-neighborhood statistics!

EASTSIDE
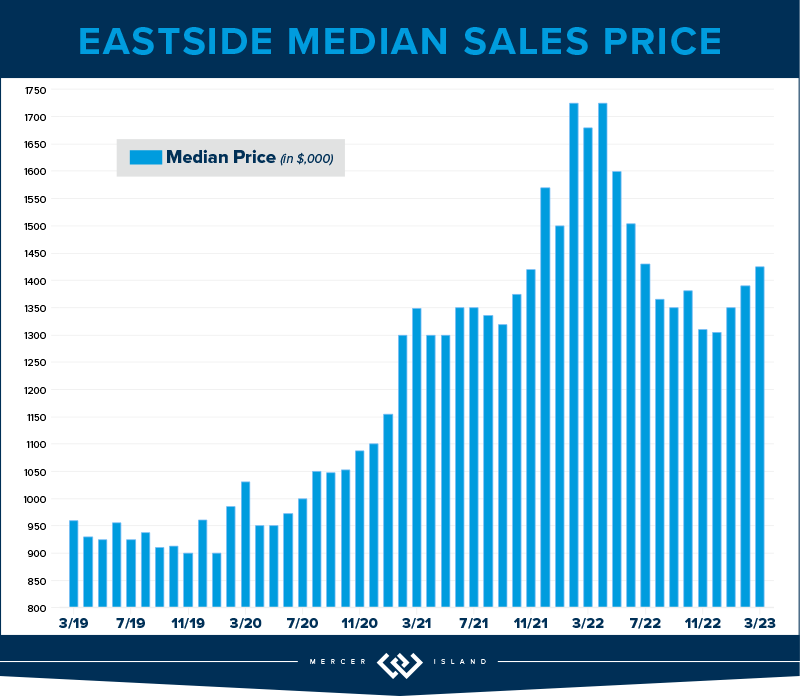
The Eastside was struck by job layoffs in the tech sector, rising interest rates and new property listings (28% more homes than last quarter!) but pending sales remained low compared to the previous year. Transaction volume was much like Seattle’s, with a decline of 22%. Mercer Island was the only community that stayed steady (no increase) in the number of transactions year over year.
Interestingly, while prices are down to a median of $1,400,000 year over year, this is a slight 2% increase from last quarter’s median of $1,380,000. 20% of the properties on the Eastside also sold above their listing price (most of these homes were in Bellevue) while sellers needed a shift in expectations with a whopping 58% of homes needing a price improvement to find their buyer. The list price vs. sold price percentage was 97% which means if you were a seller who listed your home at $1,000,000, you would expect to sell for $970,000 this quarter. Again, price and presentation matter and 41% of sellers who did this well sold in the first 10 days.
Buyers who are shopping for homes on the Eastside continue to be hyper focused on the school districts, turn-key properties and are serious about locking in their interest rate now, with the hopes of refinancing later this year when economists predict rates could decrease. If rates drop below 5.5% coupled with low inventory levels, we could see the frequency of multiple offers increase.
Click here for the full report and neighborhood-by-neighborhood statistics!
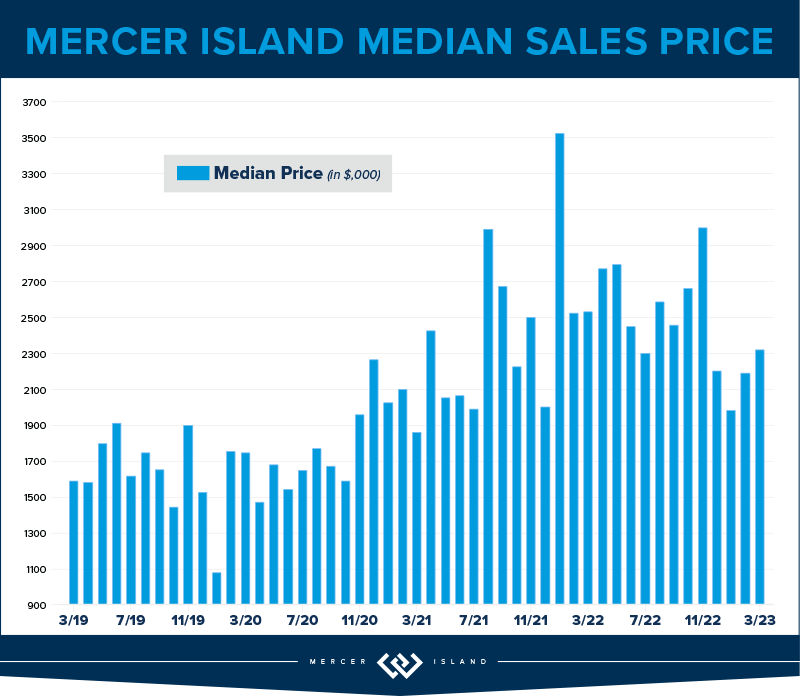
MERCER ISLAND
Even though there were just 39 residential transactions on Mercer Island this quarter, that number has stayed perfectly steady year over year. Over half of these homes sold in the first 10 days on the market, which is no surprise as demand has stayed robust.
13% of listings sold above their listing price, but this wasn’t concentrated on a certain community; four homes located on First Hill, Mid-Island plus the South & North Ends respectively, each received multiple offers this quarter. Q1 of 2022 saw a median price of $2,540,000 with just one home listed under $1,500,000. This quarter, the median price is $2,233,000 (a 12% decline) while six homes sold under $1,500,000! Due to the decline in prices and a slower start to the year, many sellers needed a shift in expectations with a whopping 67% of homes needing a price improvement to find their buyer.
We haven’t seen the number of new listings in the double-digit figures since Q2 of 2022, and it’s very possible we won’t experience that same level of inventory this year. Baby boomers are holding onto their homes with the benefit of their remarkably low 2.75% interest rate, and families are staying put to finish out the school year.
Our advice still stands: if you’re thinking about waiting for lower rates AND lower prices, you might be dreaming. Enjoy the fantastic Island inventory now, lock in your rate and consider refinancing later this year or next spring when economists predict rates will shift down.
Click here for the full report and neighborhood-by-neighborhood statistics!

CONDOS – SEATTLE & EASTSIDE
Seeing first time homebuyers come back to the market or considering an investment? Buying a condo in Seattle or on the Eastside is a fantastic opportunity, especially as many companies are calling their employees back to the office at least 3 days per week. It’s very possible transaction volume will be up next quarter, but for now, transactions were down 44% year over year. With that said, 465 units sold in Seattle; 347 units sold on the Eastside which isn’t all doom and gloom.
Just like North Seattle is heating up with residential sales, Lake Forest Park, Shoreline, Ballard and North Seattle condos outpace the rest of Seattle, up 10% on average. These areas are experiencing new construction townhomes that are especially desirable to first time homebuyers. Boutique builders are offering a trendy design palette (have you seen the Scandinavian-style design with light woods and sleek finishes?) paired with all the “bells and whistles” that city dwellers appreciate, like dog washing stations, artificial turf, and EV chargers.
For the Eastside, Redmond condos stayed the steadiest, down just 17% year or year. Kirkland was the only neighborhood to experience a price bump, up 11% to a median price of $693,000.
The Seattle condo median price has declined just 1% year over year to $515,000, while the Eastside experienced a 12% adjustment to $550,000. This is a $530,000 average when comparing both areas. With interest rates doubling the past 1.5 years and buyers considering a condo unit under the umbrella of a condo association, shoppers will be very particular about their monthly dues assessment and what’s included for those monies as both interest rates and dues have such a dominant effect on their overall buying power. Condos continue to be a necessary niche in our marketplace!
Check out area-by-area details the full condo report.
WATERFRONT
There were 17 privately-owned waterfront home sales in the greater Seattle-Eastside region in Q1 2023 (Eastside-7; Seattle-6; Lake Sammamish-2; Mercer Island-2). This is exactly on par with last year, when we also saw 17 sales in Q1 2022.
The highest sale was for a Medina Northwest Contemporary on 115 feet of low-bank waterfront that sold above list price for $20m. The most affordable waterfront was a unique triplex with 1920-1930 era beach cottages on a private boardwalk near the Ballard Locks—a buyer snagged it below list price for $1.9m.
This brief overview of the entire Seattle-Eastside private waterfront market, including Mercer Island and Lake Sammamish, illustrates the trends occurring in our region over time. This data is interesting and insightful but cannot replace an in-depth waterfront analysis with your trusted professional.
© Copyright 2023, Windermere Real Estate/Mercer Island. Information and statistics derived from Northwest Multiple Listing Service and Trendgraphix, and deemed accurate but not guaranteed. Mercer Island cover photo courtesy of Petra Varney and Clarity Northwest Photography.

