 Facebook
 X
X
 Pinterest
 Copy Link
Are You Paying Too Much for Property Taxes?

OK nobody panic, but it’s almost…TAX TIME. For Washington State homeowners, this means you’ve probably received a little postcard letting you know your property’s assessed value and taxes due for 2025. Those with a mortgage on their home may be tempted to file this away and let the bank take care of it (after all, that’s what your mortgage escrow fund is for). However, everyone should take a close look no matter who is writing the check—you may be over-paying taxes if your home’s assessment is above fair market value. You or a loved one who is a low-income senior or disabled may also be paying too much if you haven’t taken advantage of available exemptions. Read on for solutions to these issues as well as important deadlines to keep you on track. (Looking for income tax tips, too? Check out this article for homeowners.)
Assessments & Valuation | Exemptions & Deferrals | Important Dates
Assessments & Valuation
Each county has an assessor tasked with appraising real property at its true and fair market value, according to the highest and best use of the property. Fair market value is defined as, “the amount that a willing and unobligated buyer is willing to pay a willing and unobligated seller.” While three appraisal methods are accepted, the most common approach is to estimate value based on sales of similar properties. This is known as the Market or Sales Comparison approach and is typically pretty accurate. In fact, it’s what real estate agents use when they prepare CMA valuation estimates.
However, the county’s assessed value can be incorrectly high for a number of reasons. For example, if your property suffered recent damage or depreciation that wasn’t taken into account (physical inspections are only required once every six years). The highest and best use might also be incorrect, such as vacant land that is assessed as develop-able but in fact cannot support a septic system.
If you feel your assessment is too high, there are a number of steps you can take. A good first step is to contact your local county assessor’s office. You can request copies of the comparable sales that were used to appraise your property’s value, and can also inform them of any errors or information that should have been taken into account. Disagreements are often settled at this level without any further action needed.
If you can’t come to a resolution with the assessor, the next step would be to file an appeal with your county’s board of equalization (BOE). If you or the assessor disagrees with the BOE’s decision, it can then be appealed to the State Board of Tax Appeals (BTA). In some cases, the decision made by the BTA can also be appealed in Superior Court. Keep in mind that any appeal you make will require you to provide market evidence that the assessed value does not truly reflect the fair market value.
Exemptions & Deferrals
Low-income senior homeowners who are age 61+ or people unable to work due to a disability (or their surviving spouses/domestic partners age 57+) may be eligible for a property tax exemption. This lowers the amount of taxes that are owed each year. For King County, the maximum income is $84,000 (find income guidelines for other counties here).
Seniors, low-income or disabled people who don’t meet the guidelines for an exemption may still be eligible for a property tax deferral. While this doesn’t reduce the taxes owed, it does allow you to defer taxes (including special assessments and back taxes) as a lien on the property that can be repaid either as funds become available or when the property is sold. 5% interest is assessed on the deferred amount.
Find application info plus more property tax relief programs in this article on Property Tax Relief Programs.
Important Dates
January 1st: Property is valued for taxes due in the next year.
March 31st: Applications are due for the Senior/Disabled Deferral and Widow/Widower Assistance.
April 30th: The first half of property taxes are due (or full amount if you owe less than $50).
May 1st: 1% per month (12% per annum) is assessed on any overdue taxes.
June 1st: A 3% penalty is assessed for any overdue taxes in the current year.
July 1st: Deadline to file an appeal with the County Board of Equalization (BOE) for the current year’s assessment (or 30 days from the date of notification if it’s later).
August 31st: New construction is placed on the assessment roll based on the valuation determined July 31st.
September 1st: Applications for the Limited Income Deferral are due.
October 31st: The second half of property taxes are due.
December 1st: An 8% penalty is assessed for any overdue taxes in the current year.
December 31st: Property tax exemption applications are due for seniors and those with disabilities.
For more info, contact the Washington State Department of Revenue at dor.wa.gov or (360) 705-6705. You can also find a lot of great info in their Homeowner’s Guide to Property Tax publication.
Psst…I love giving you these helpful tips but they can’t replace the advice of your tax professional. Reach out to your pro for counsel on the best course of action for your unique situation.

We earn the trust and loyalty of our brokers and clients by doing real estate exceptionally well. The leader in our market, we deliver client-focused service in an authentic, collaborative, and transparent manner and with the unmatched knowledge and expertise that comes from decades of experience.
© Copyright 2025, Windermere Real Estate/Mercer Island.
Our Favorite Local Pumpkin Patches
Grab your boots, pack a thermos…it’s time to choose those perfect Halloween pumpkins! This year, why not explore a new town and make your pumpkin patch experience a true adventure? All of these farms are open every weekend in October, and some are open on weekdays too. Some even welcome your furry family members on a leash. Scroll down for the full scoop!
Eastside | North of Seattle | South of Seattle
Eastside
Fletcher Farm
Dog-friendly with a scavenger hunt, farm animal zoo, storybook trail, mini-golf, photo stations, and junior corn maze for the little ones. End of season Halloween Bash, too!
Open Sat & Sun, 11a-6p | Every weekend from 9/28-10/27
18712 SE May Valley Road | Issaquah
fletcherfarmevents@gmail.com
fletcherfarmissaquah.com
Jubilee Farm
Hay rides, food trucks, animals, barn store, & hot apple cider.
Open Sat & Sun, 10a-5p | Every weekend in October
229 W Snoqualmie River Rd NE | Carnation
(425) 222-4558
jubileefarm.org
Novelty Hill Farm
Dog-friendly! Corn maze, farm critters, trike track, hay mow, & picnic/fire pit rentals.
Open Fridays, 3-6p & Sat/Sun, 10a-5p | 9/27-10/27
26617 NE 124th Street | Duvall
(425) 788-2416
noveltyhillfarm.com
Oxbow Farm & Conservation Center
Live music, face painting, clue hunt, hay rides, mini pumpkin painting, living playground, kids’ farm tours, & apple slingshot.
Sat, 10/19 & Sun, 10/20 | 10a-4p
10819 Carnation-Duvall Rd. NE | Carnation
(425) 788-1134
oxbow.org/oxtober
Remlinger Farms
25 rides & attractions for children (including a train, carousel, & mini roller-coaster!), pony rides, apple cannon, cafe, & brewery with 20 choices on tap.
Open Sat & Sun, 10:30a-4:30p | Every weekend from 9/28-10/27
32610 NE 32nd Street | Carnation, WA
(425) 333-4135
remlingerfarms.com
Serres Farm
Mini train rides, corn maze and a dazzling variety of specialty pumpkins.
Open Sat & Sun, 9a-5p | Every weekend in October
20306 NE 50th St | Redmond, WA
(425) 868-3017
serresfarm.com/pumpkin-patch
Two Brothers Pumpkins at Game Haven Farm
Farm animals and an eerie number of well-attired scarecrows.
Open 9:30a-6p | Every weekend in October
7110 310th Avenue NE | Carnation, WA
(425) 333-4313
facebook.com/twobrotherspumpkins
North of Seattle
Bailey Vegetables
U-pick apples and kids play area with hay run, farm trikes & sandbox. Weekend kettle corn, cider and donuts, too!
Open Weekends, 10a-5:30p & Weekdays 12-5:30p | Late September-October
12698 Springhetti Rd | Snohomish
(360) 568-8826
baileyveg.com/pumpkin-patch
Bob’s Corn & Pumpkin Farm
12-acre corn maze, 2 kids’ mazes, play barn, hay rides, trike track, & apple cannon. Fire pit rentals for private groups, too!
Open Daily, 10a-7p (Last entry @5p) | 9/14-10/31
10917 Elliott Road | Snohomish
(360) 668-2506
bobscorn.com/Pumpkins
Carleton Farm
Corn maze, play area, jump pad, paintball shooting gallery, apple cannons, hay rides, & kids’ bucket train.
Open M-Sa, 10a-6p & Sun, 10a-5p | 9/28-10/31
630 Sunnyside Blvd SE | Lake Stevens, WA
(425) 343-4963
carletonfarm.com
Craven Farm
15-acre corn maze, kids maze, axe throwing, farm animals, mini golf, cow train, foosball, apple cannon, espresso, cider donuts, & scarecrow making. Fire pit rentals and special dog-friendly days, too!
Open Fri-Sun, 9:30a-6p | 9/14-9/30
Open Wed-Sun, 9:30a-6p | 10/1-10/27
13817 Short School Road | Snohomish
(360) 568-2601
cravenfarm.com/fall-festival
Fairbank Animal & Pumpkin Farm
Lots of baby animals, corn “maize maze,” tiny tot hay tunnel, toy duck races, photo boards, & veggie garden.
Open 10a-5p | Every weekend in October
15308 52nd Ave W | Edmonds
(425) 743-3694
fairbankfarm.com
Stocker Farms
30+ attractions including a mega slide, giant jumping pillow, tire mountain, epic play area, zip line, corn maze, pumpkin cannon, & more. The farm’s evil twin, Stalker Farms, comes out at night.
Open Daily 10a-6p (Last entry @5p) | September 21, 22, 28, & 30 | October 1-31
8705 Marsh Rd | Snohomish
(360) 568-7391
stockerfarms.com
Swans Trail Farms
Washington State corn maze, kids corn maze, petting farm, wagon rides, big slides, zip lines, u-pick apple orchard & live duck races.
Open Daily 10a-6p (Last entry @5p) | 9/14-10/31
7301 Rivershore Rd | Snohomish
(425) 330-3084
swanstrailfarms.com
South of Seattle
Carpinito Brothers Corn Maze & Pumpkin Patch
Rubber duck races, hay slides, corn pit, farm animals, hay maze, & corn maze.
Open Daily 9a-6p (or until dusk) | 9/27-10/31
Pumpkin Patch: 27508 W Valley Hwy N | Kent
Farm Fun Yard: 6720 S 277th St | Kent
(206) 786-4011
carpinito.com
Maris Farms
Racing pigs & ducks, mega slide, corn maze, jump pillow, animals, zip lines, rides, plus the creepy “Haunted Woods” complete with zombies and homicidal maniacs.
Open Fri-Sat 10a-10p, Sun 10a-7p | 9/28-10/27
25001 Sumner-Buckley Highway | Buckley
(253) 862-2848
marisfarms.com
Mosby Farms
Dog-friendly! Corn maze and fresh farm market.
Open Daily 10a-5:30p | 9/28-10/30
3104 SE Auburn-Black Diamond Rd | Auburn
(253) 939-7666
mosbyfarm.com/pumpkinpatch
Spooner Farms
Corn maze, pumpkin sling shot, speedway, farm animals, caramel apples, & roasted corn.
Open Daily 9a-6p | 9/28-10/31
9710 State Route 162 East | Puyallup
(253) 840-2059
spoonerberries.com
Thomasson Family Farm
Laser tag, corn maze, play barn, farm animals, slides, duck races, trike track, apple slingshot, and giant Jenga & Connect 4.
Open Daily 9:30a-5:30p | 9/28-10/30
38223 236th Avenue SE | Enumclaw
contactus@thomassonfamilyfarm.com
thomassonfarm.com
We earn the trust and loyalty of our brokers and clients by doing real estate exceptionally well. The leader in our market, we deliver client-focused service in an authentic, collaborative, and transparent manner and with the unmatched knowledge and expertise that comes from decades of experience.
© Copyright 2024, Windermere Real Estate / Mercer Island.
Q4 2022 Western Washington Economic & Real Estate Update
The following analysis of select counties of the Western Washington real estate market is provided by Windermere Real Estate Chief Economist Matthew Gardner. I hope that this information may assist you with making better-informed real estate decisions. For further information about the housing market in your area, please don’t hesitate to contact me.
Regional Economic Overview
Although the job market in Western Washington continues to grow, the pace has started to slow. The region added over 91,000 new jobs during the past year, but the 12-month growth rate is now below 100,000, a level we have not seen since the start of the post-COVID job recovery. That said, all but three counties have recovered completely from their pandemic job losses and total regional employment is up more than 52,000 jobs. The regional unemployment rate in November was 3.8%, which was marginally above the 3.7% level of a year ago. Many business owners across the country are pondering whether we are likely to enter a recession this year. As a result, it’s very possible that they will start to slow their expansion in anticipation of an economic contraction.
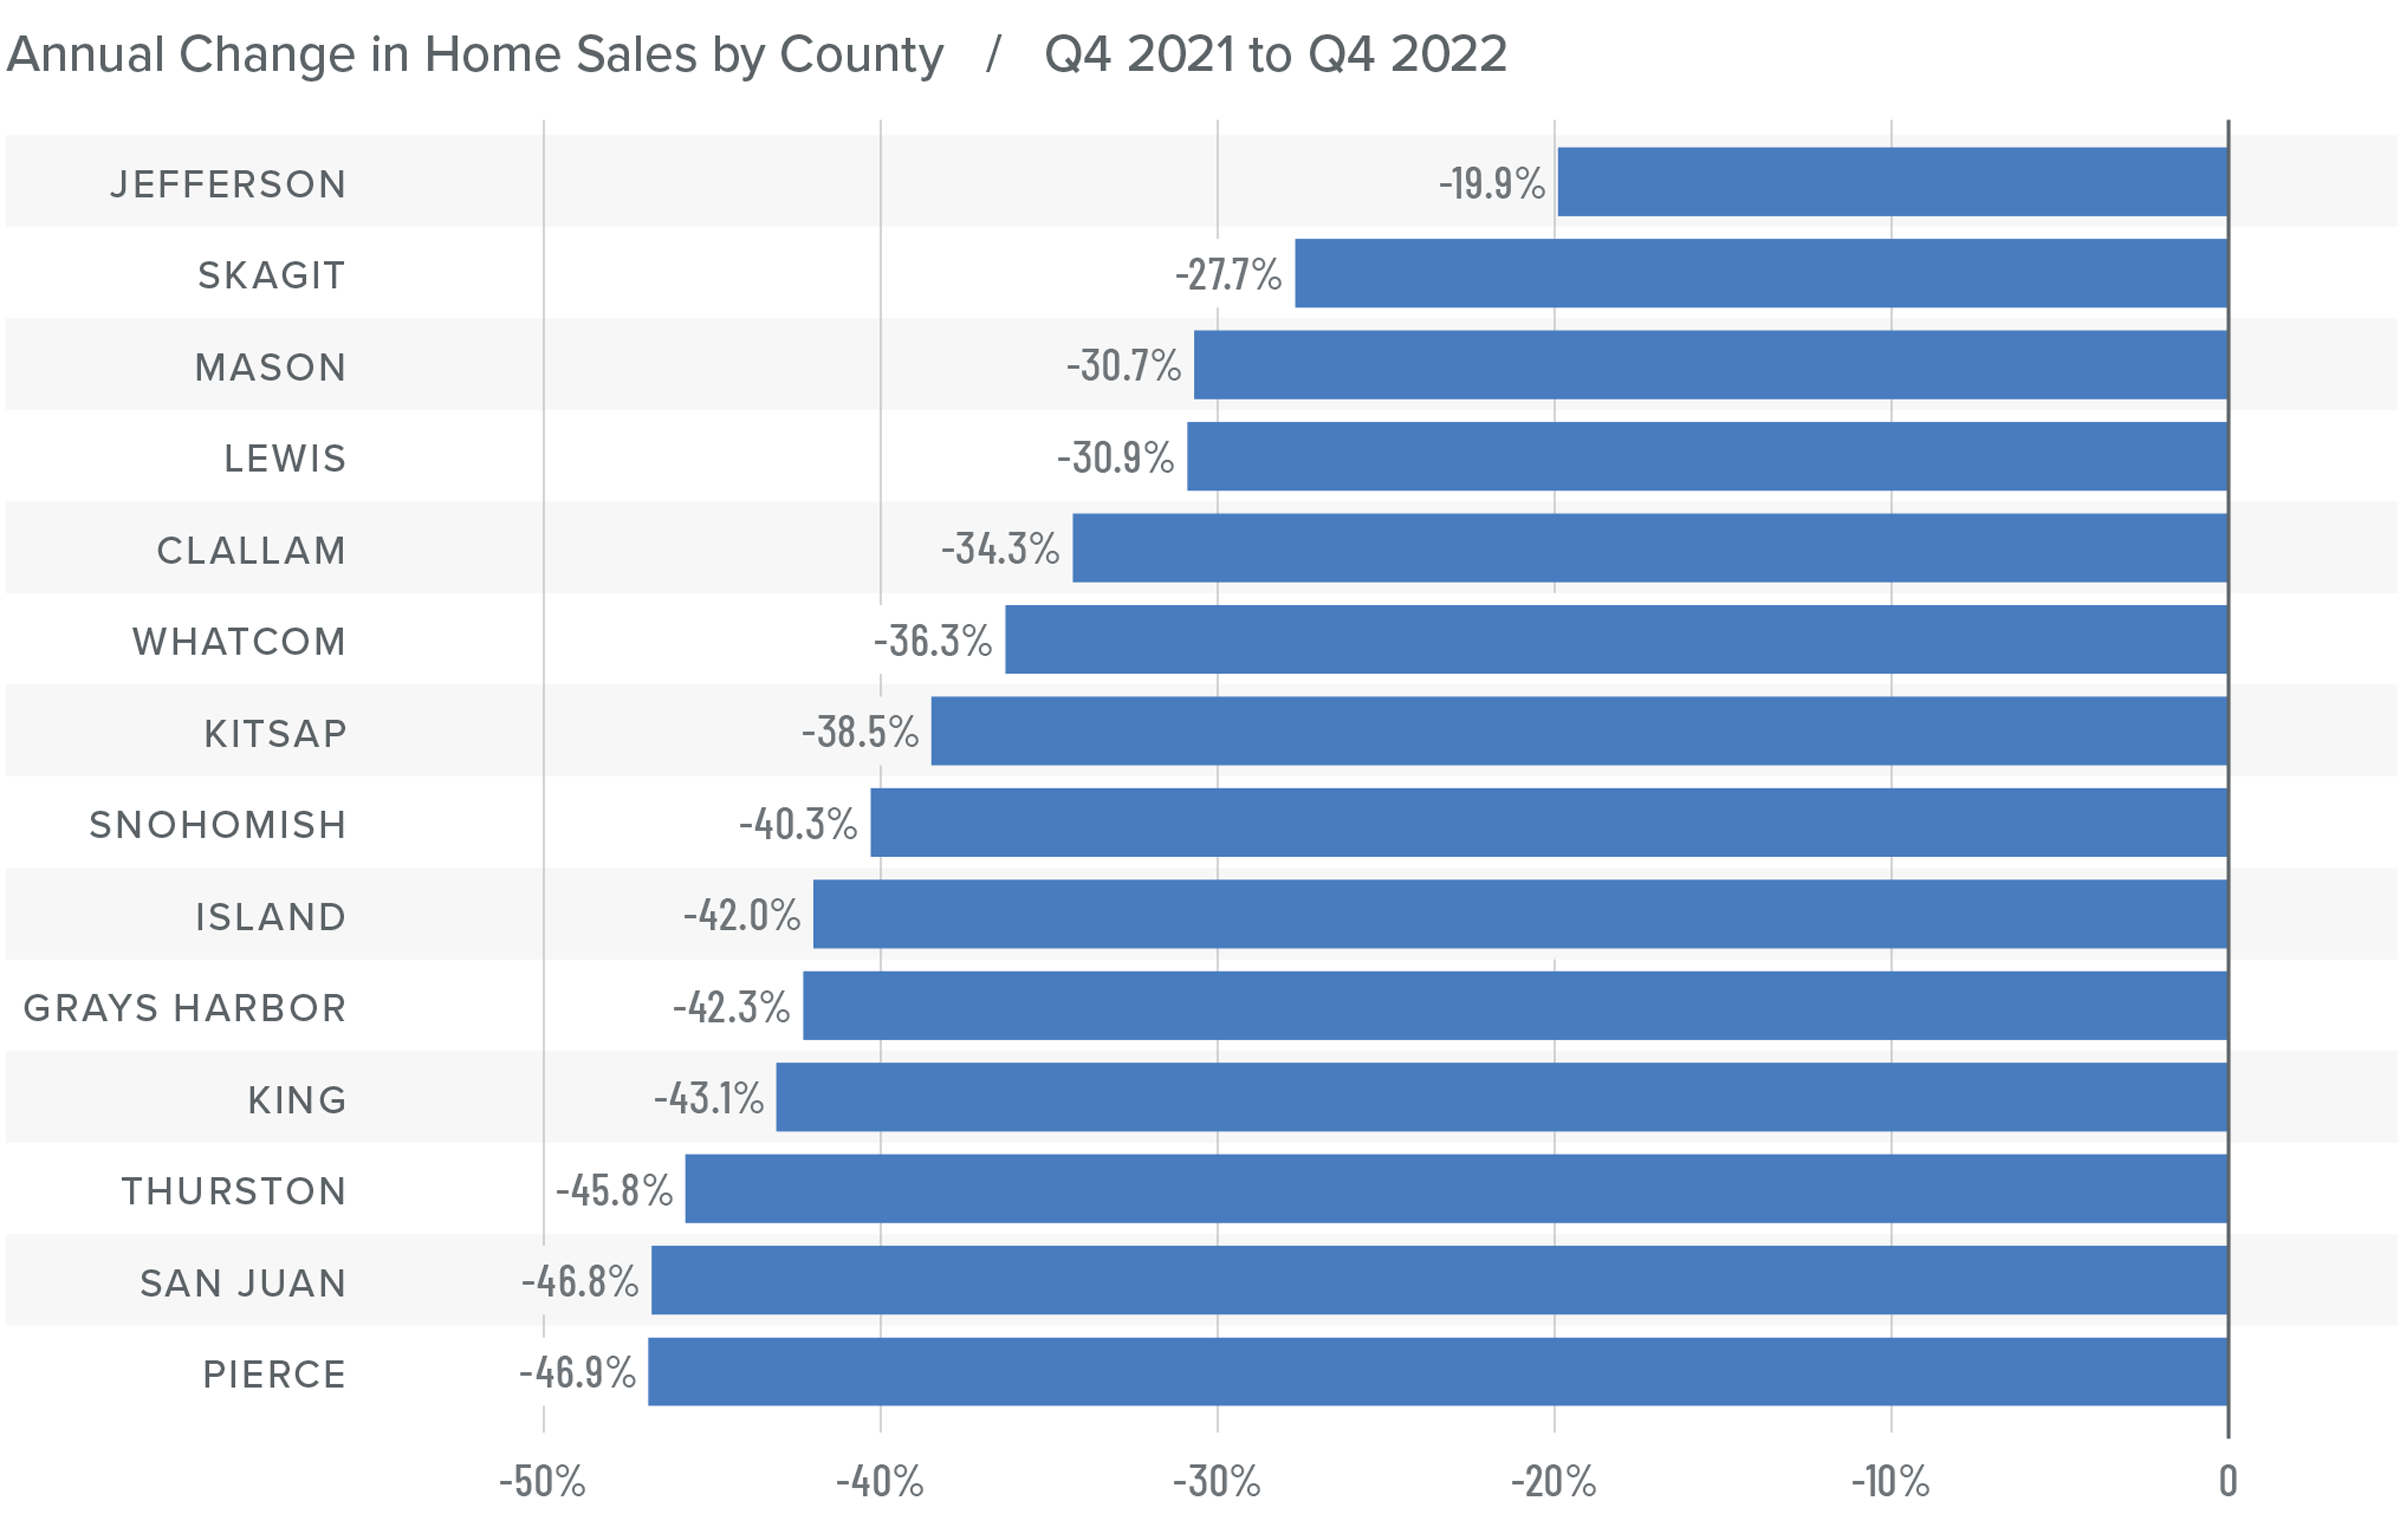
Western Washington Home Sales
❱ In the final quarter of 2022, 12,711 homes sold, representing a drop of 42% from the same period in 2021. Sales were 34.7% lower than in the third quarter of 2022.
❱ Listing activity rose in every market year over year but fell more than 26% compared to the third quarter, which is expected given the time of year.
❱ Home sales fell across the board relative to the fourth quarter of 2021 and the third quarter of 2022.
❱ Pending sales (demand) outpaced listings (supply) by a factor of 1:2. This was down from 1:6 in the third quarter. That ratio has been trending lower for the past year, which suggests that buyers are being more cautious and may be waiting for mortgage rates to drop.
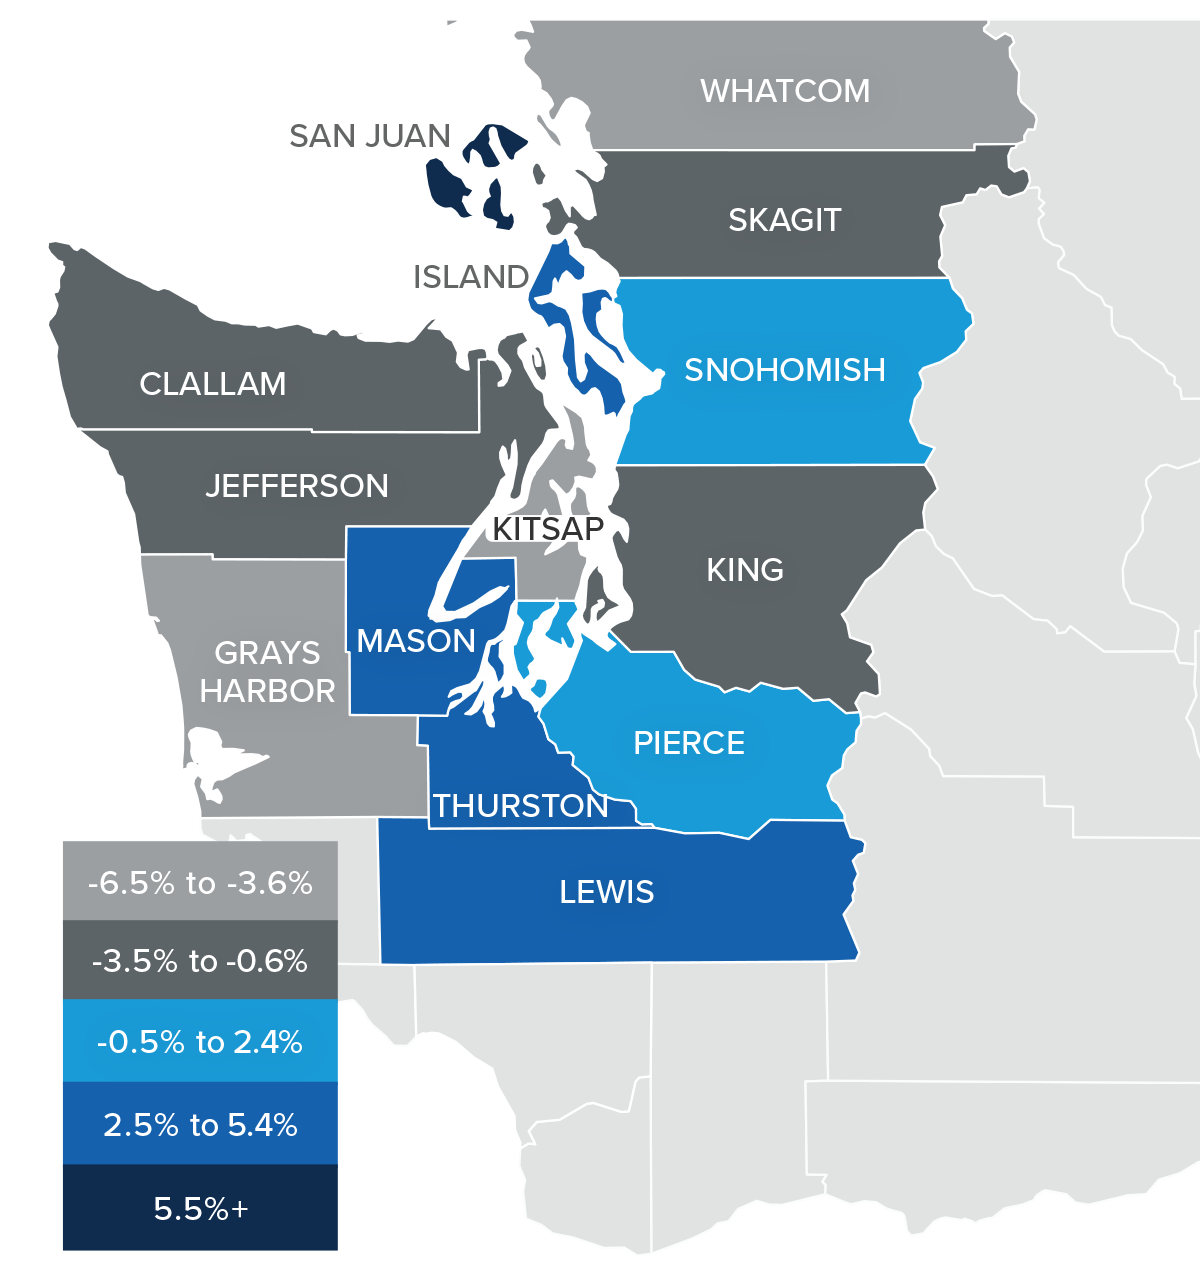
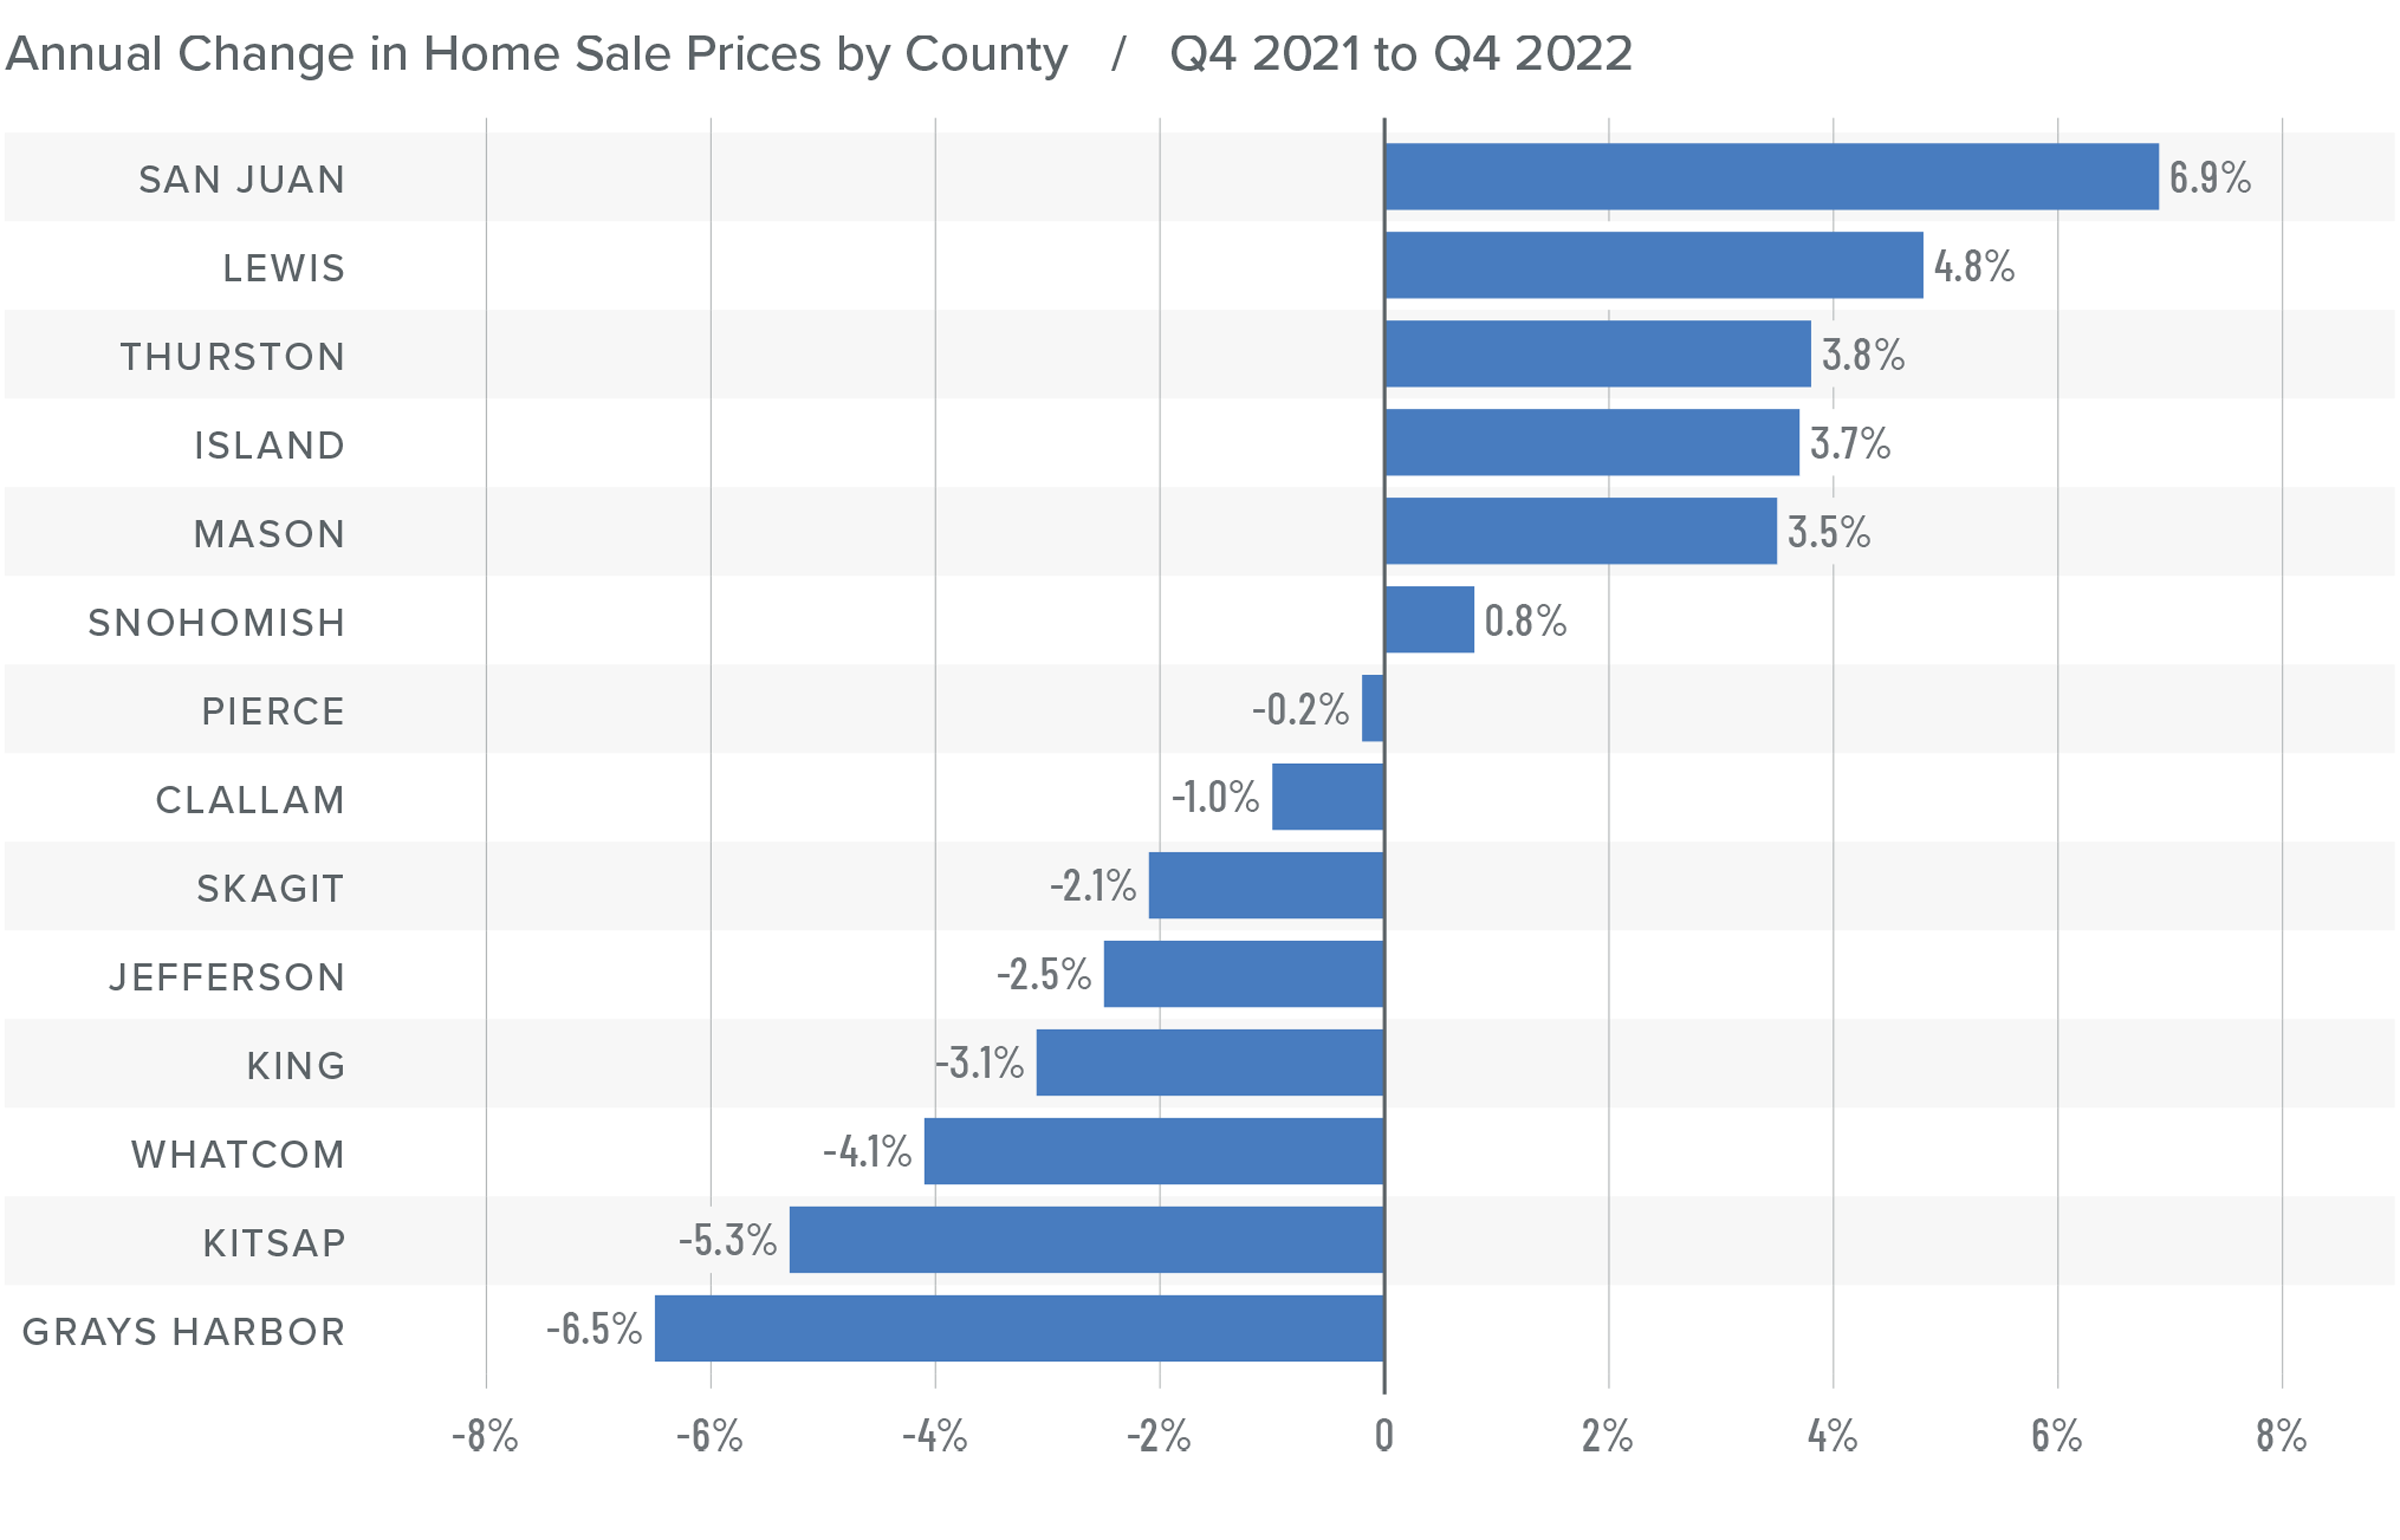
Western Washington Home Prices
❱ Sale prices fell an average of 2% compared to the same period the year prior and were 6.1% lower than in the third quarter of 2022. The average sale price was $702,653.
❱ The median listing price in the fourth quarter of 2022 was 5% lower than in the third quarter. Only Skagit County experienced higher asking prices. Clearly, sellers are starting to be more realistic about the shift in the market.
❱ Even though the region saw aggregate prices fall, prices rose in six counties year over year.
❱ Much will be said about the drop in prices, but I am not overly concerned. Like most of the country, the Western Washington market went through a period of artificially low borrowing costs, which caused home values to soar. But now prices are trending back to more normalized levels, which I believe is a good thing.
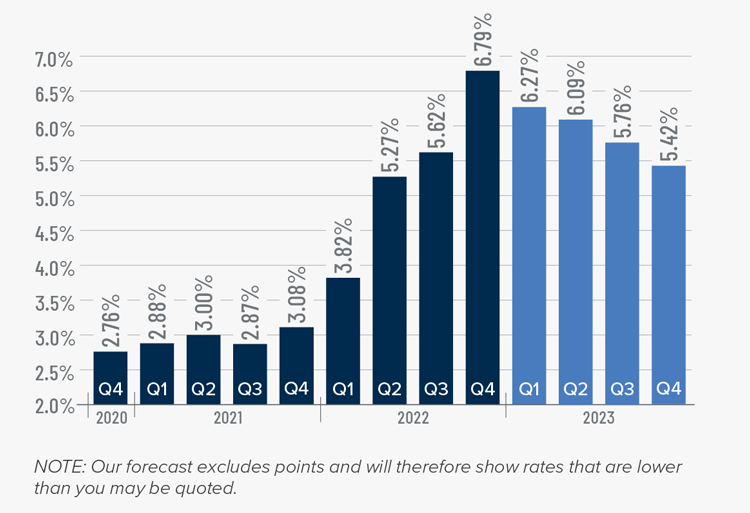
Mortgage Rates
Rates rose dramatically in 2022, but I believe that they have now peaked. Mortgage rates are primarily based on the prices and yields of bonds, and while bonds take cues from several places, they are always impacted by inflation and the economy at large. If inflation continues to fall, as I expect it will, rates will continue to drop.
My current forecast is that mortgage rates will trend lower as we move through the year. While this may be good news for home buyers, rates will still be higher than they have become accustomed to. Even as the cost of borrowing falls, home prices in expensive markets such as Western Washington will probably fall a bit more to compensate for rates that will likely hold above 6% until early summer.
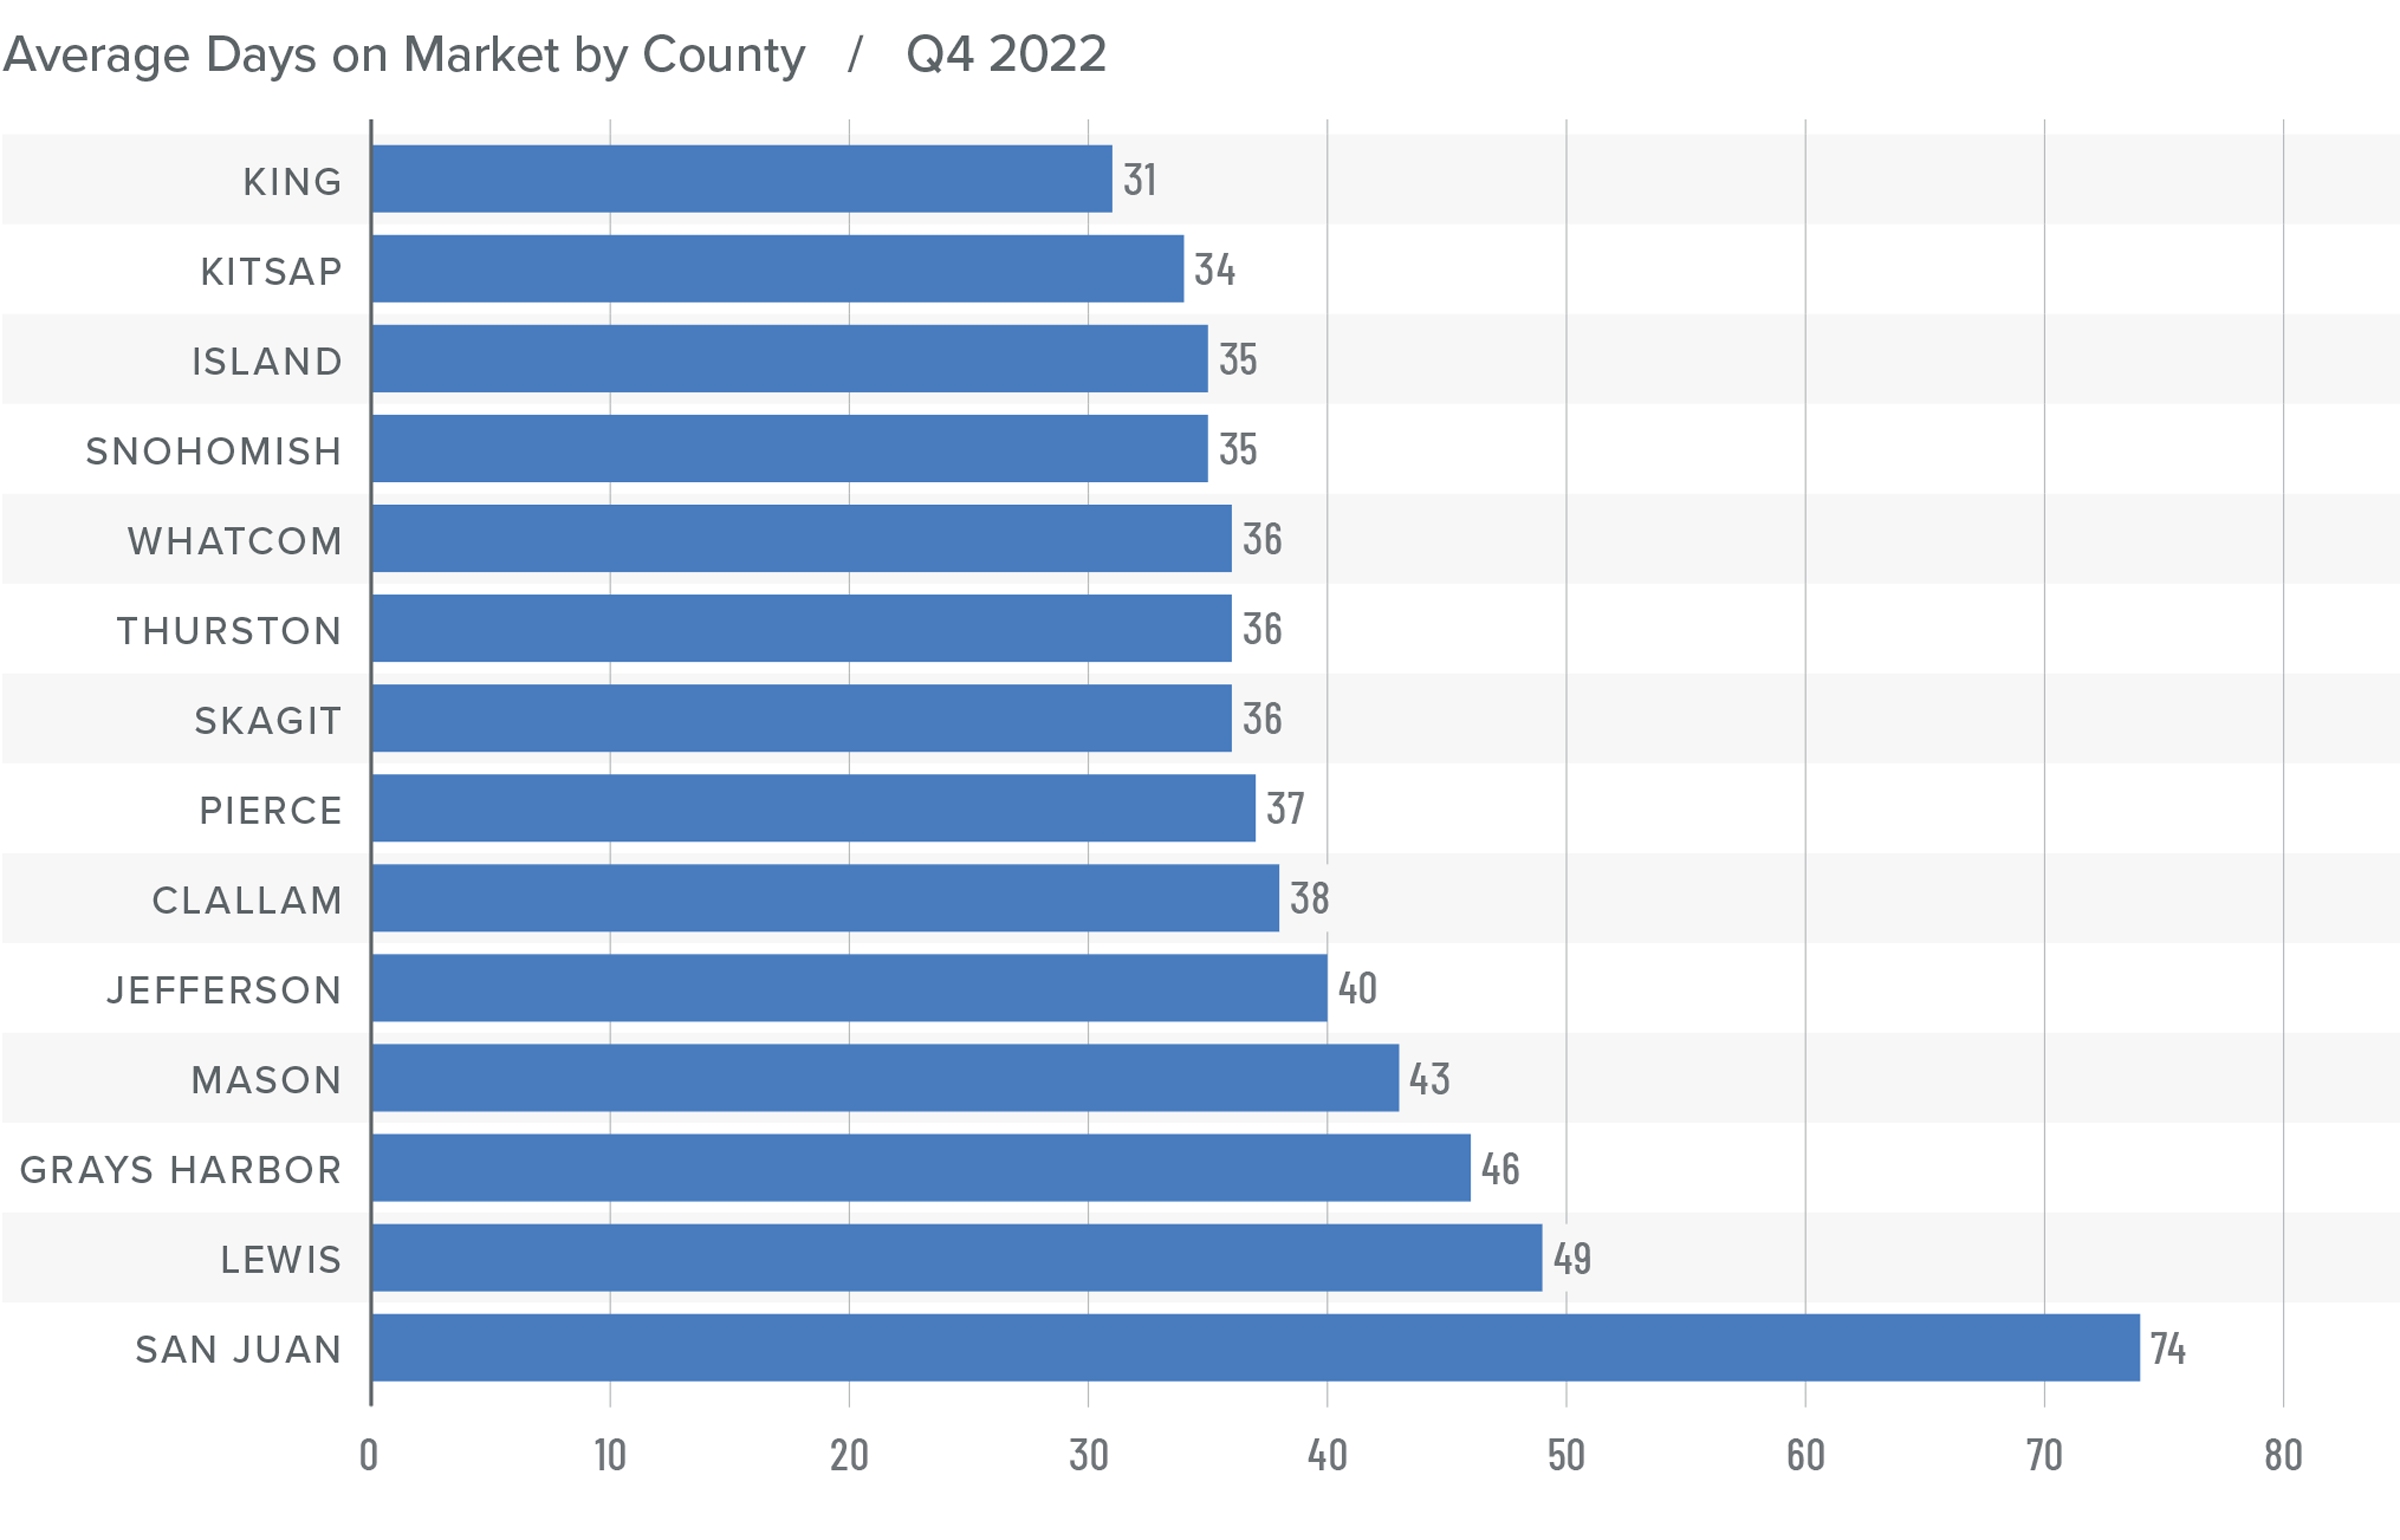
Western Washington Days on Market
❱ It took an average of 41 days for homes to sell in the fourth quarter of 2022. This was 17 more days than in the same quarter of 2021, and 16 days more than in the third quarter of 2022.
❱ King County was again the tightest market in Western Washington, with homes taking an average of 31 days to find a buyer.
❱ All counties contained in this report saw the average time on market rise from the same period a year ago.
❱ Year over year, the greatest increase in market time was Snohomish County, where it took an average of 23 more days to find a buyer. Compared to the third quarter of 2022, San Juan County saw average market time rise the most (from 34 to 74 days).
Conclusions
This speedometer reflects the state of the region’s real estate market using housing inventory, price gains, home sales, interest rates, and larger economic factors.
The regional economy is still growing, but it is showing signs of slowing. Although this is not an immediate concern, if employees start to worry about job security, they may decide to wait before making the decision to buy or sell a home. As we move through the spring I believe the market will be fairly soft, but I would caution buyers who think conditions are completely shifting in their direction. Due to the large number of homeowners who have a mortgage at 3% or lower, I simply don’t believe the market will become oversupplied with inventory, which will keep home values from dropping too significantly.

Ultimately, however, the market will benefit buyers more than sellers, at least for the time being. As such, I have moved the needle as close to the balance line as we have seen in a very long time.
About Matthew Gardner

As Chief Economist for Windermere Real Estate, Matthew Gardner is responsible for analyzing and interpreting economic data and its impact on the real estate market on both a local and national level. Matthew has over 30 years of professional experience both in the U.S. and U.K.
In addition to his day-to-day responsibilities, Matthew sits on the Washington State Governors Council of Economic Advisors; chairs the Board of Trustees at the Washington Center for Real Estate Research at the University of Washington; and is an Advisory Board Member at the Runstad Center for Real Estate Studies at the University of Washington where he also lectures in real estate economics.
This article originally appeared on the Windermere blog January 26th, 2023. Written by: Matthew Gardner.

© Copyright 2023, Windermere Real Estate/Mercer Island.
