 Facebook
 Twitter
 Pinterest
 Copy Link
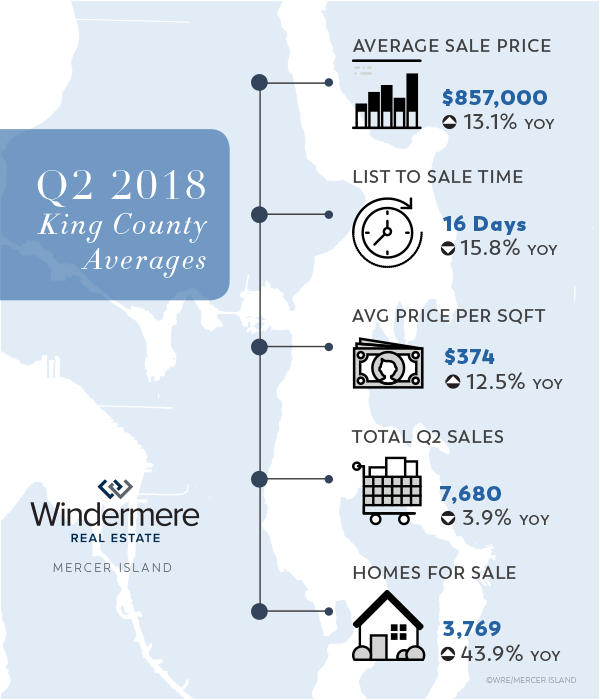
Q2 2018 Seattle-Eastside Real Estate Report


Signs of transition to a more balanced market are becoming abundantly clear as we move further into 2018. Price growth, while still climbing in most areas, has tapered off and average market times are inching up. Brokers are beginning to dust off forms that have seen little use of late—finance and inspection contingencies—as buyers gain a stronger foothold at the negotiating table.
Some homes are still garnering multiple offers and commanding incredible prices and terms, but many more are seeing negotiations more equalized with fewer buyers at the table. Seattle has needed this return to balance for a very long time. It is likely that buyers who were beaten down and bruised over the past couple of years will return to the house hunt, but it will likely be on their own terms. Waiving all contingencies, releasing a substantial earnest money to the seller up front, and giving the seller a period of free possession after closing will be reserved for only the most coveted homes.
On the other hand, being able to conduct thorough due diligence on a prospective home over a comfortable period after offer acceptance is a buyer right that is returning to the picture. It has been a long time since that was even possible in the hottest neighborhoods. So long, it seems almost foreign. Yet that equalization of power is long overdue and needed to stabilize our market.
Overall median Q2 ‘17 to Q2 ‘18 prices in Seattle rose 11.3% to $801,000, while the Eastside rose 9.1% to $960,000. The average cost per home square foot was $459 in Seattle and $426 on the Eastside (which tends to have larger homes—2,752 square feet vs Seattle’s 2015 square feet—and thus a lower cost per square foot to construct).
Home mortgage interest rates have continued to rise, averaging 4.54% in Q2 putting continued pressure on buyers to purchase before they are simply priced out of the Seattle-Eastside market. Our region is entering a sweet spot where home prices are stabilizing and have likely peaked but interest rates are still affordable. Because rising interest rates have a much larger impact on the monthly mortgage than home price, values would have to fall pretty sharply to offset the impact of a 1-2% increase in mortgage interest rates.
SEATTLE

Up 20.7%, affordable Richmond Beach and Shoreline saw the strongest price growth in Q2 followed closely by Lake Forest Park and Kenmore at 19.4%. West Seattle, South Seattle, Madison Park/Capitol Hill, and Queen Anne/Magnolia all saw increases in the mid-teens. Surprisingly, Ballard-Greenlake and North Seattle—strong contenders in the past couple of years—slowed to 11.8% and 6.3% respectively.
Click here to view the complete report for a neighborhood by neighborhood breakdown of Average Sale Price, size, and number of homes sold.
EASTSIDE

Kirkland was the height of the storm on the Eastside drawing a median price gain of 30.6% over Q2 of last year. This was very loosely followed by Juanita/Woodinville at 14.4%, West Bellevue at 14.0%, and Redmond at 11.2%. South Eastside 7.5%, East Bellevue 7.4%, East of Lake Sammamish 6.9%, and Mercer Island 4.5%, all below the Eastside median, represented the fringe of Q2 appreciation.
Click here for the full report and neighborhood-by-neighborhood statistics!
MERCER ISLAND

Mercer Island, with only two homes priced below $1 million, struggles with the lack of affordability at mainstream price points. While the number of $1-2 million homes for sale is up sharply (46%), finally giving buyers more options to choose from, the pace of sales in that price point has cooled off as buyers wait for the perfect home. A glut of homes for sale in the $3-5 million range—up 67% over this time last year—has caused that segment of the market to stagnate. Homes in the $2-3 million and $5 million plus ranges have fared slightly better than their middle sibling. Mercer Island condos, the only affordable option on the Island, have soared in value with recent sale prices creating shock waves within the industry.
Click here to view the complete report for a neighborhood by neighborhood breakdown of Average Sale Price, size, and number of homes sold.
CONDOS – SEATTLE & EASTSIDE

The number of Seattle metro condos for sale has steadily climbed in Q2 while those available in downtown Bellevue have diminished. Condo prices have continued to outpace their residential counterparts as demand to affordably own vs rent at astronomical prices drives buyer interest. Seattle condos appreciated 20.4-34.6% in all but two markets, North Seattle up 5.6% and SODO/Beacon Hill down 4.5%. On the Eastside, condos were up 13.3-35.2% except for Kirkland up 8.2% and West Bellevue down 3.5%. Not included in these numbers are the newly underway Bosa 188 condos which have a significant number of pending sales that will not close until 2020.
Check out all of these factoids and more in the full condo report.
WATERFRONT

Seattle and Mercer Island have fewer waterfront homes for sale in Q2 this year than in either of the past two years. The Eastside is up very slightly while Lake Sammamish has more than three-fold the number of homes for sale over the same time. The highest closed sale in Q2 was a NW-facing 1937 Yarrow Point estate on 100 feet of waterfront and just over an acre of land for $10 million. The most affordable waterfront sale was a Ripley Lane 2003-built home with 140 feet of waterfront for just shy of $1.7 million.
Check out the full Waterfront Report for a complete list of waterfront home sales by address and community.
ABOUT WINDERMERE MERCER ISLAND
We earn the trust and loyalty of our brokers and clients by doing real estate exceptionally well. The leader in our market, we deliver client-focused service in an authentic, collaborative and transparent manner and with the unmatched knowledge and expertise that comes from decades of experience.
© Copyright 2018, Windermere Real Estate/Mercer Island. Information and statistics derived from Northwest Multiple Listing Service and deemed accurate but not guaranteed.
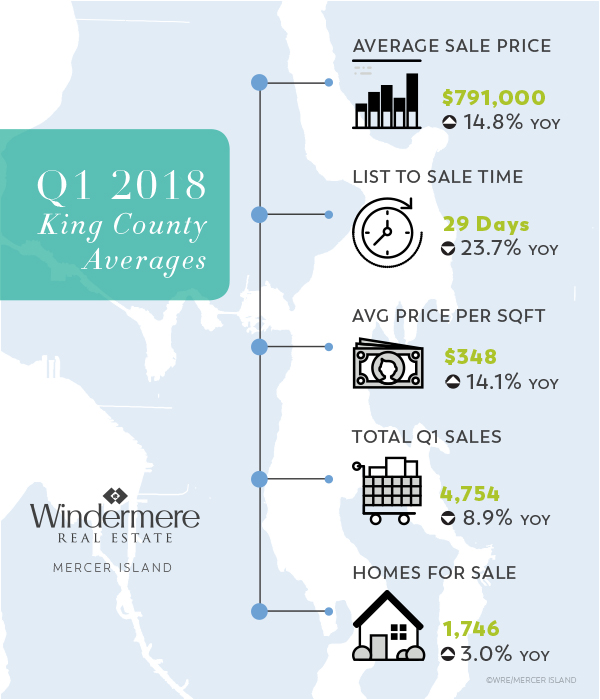
Q1 2018 Seattle-Eastside Real Estate Report


Q1 prices in the Seattle-Eastside region have escalated yet again with no sign of slowing in the immediate future. An unprecedented lack of inventory for sale coupled with rising interest rates has prompted buyers to compete with reckless abandon to win the prize of their very own home, albeit with a steep price tag.
Overall median prices in Seattle rose 16.1% to $770,000, while the Eastside rose 13.0% to $944,000. Those regional numbers certainly don’t tell the whole story, especially when you consider the highest change in median sale price was nearly 46% and the lowest was a -4%. New construction sales, or lack thereof, made the biggest impact on home sale prices. Existing homes, offering good walkability or commute options, and those that were on the more affordable end of the pricing spectrum saw the strongest appreciation overall.
Rising mortgage interest rates, now up a full percentage point from their lows, are adding fuel to the fire. While not dampening buyer demand yet, further increases will likely begin to price home buyers out of the core Seattle-Eastside region. Homebuyer fear of being priced out of the market is at least partly to blame for the crazed demand at more modest price points.
As predicted, many who don’t have a need to be close in to the metro region are choosing to sell at a high and buy more affordably outside of the Seattle-Eastside area. The rate of tear-down new construction infill has escalated at staggering numbers as builders capitalize on the market’s appetite for fresh and new.
Buyers today should consider their purchase thoughtfully as buying at or near the peak of the market can limit their resale options when the market corrects. Planning to stay put for five to seven years is a good strategy at this time.
SEATTLE
West Seattle leads the pack in median home price growth on the Seattle side of the lake. With its vibrant, hip vibe and convenient access to the city, West Seattle has benefited from Seattle’s commute gridlock—maintaining status quo while other Seattle neighborhoods have come to a halt (literally).

Queen Anne saw a nice rebound in Q1 after lagging the Seattle averages for some time. South Seattle, with its light rail access, affordable prices, and new vitality, continues to see its real estate market thrive.
Click here to view the complete report for a neighborhood by neighborhood breakdown of Average Sale Price, size, and number of homes sold.
EASTSIDE
Significant new home development at higher price points has led the market in West Bellevue and Kirkland and brought up everything else along with it.

With land values alone higher than average home sale prices in surrounding communities, this growth will have long-lasting impacts that will forever change the flavor of these communities–for better (fresh new housing stock) and worse (the lack of affordable options). Kirkland led this charge with a median sale price 45.9% higher than Q1 last year, followed by West Bellevue at 23.1%.
Click here for the full report and neighborhood-by-neighborhood statistics!
MERCER ISLAND
Overall, a much higher percentage of mid-range homes sold in the first quarter than in quarters past, giving the appearance of falling prices. In reality, however, it was actually a downward shift of the segment of the market that is selling.

Don’t let the negative number for Q1 fool you. The market below the two-million-dollar mark is vastly different than the market above it. With the most severe shortage of available homes in mid-range price points Mercer Island has seen, especially early in Q1 this year, the sub $2 million market has been brisk and competitive with strong price escalation. The $2 million and above market has been a different story altogether. While highly desirable homes in that bracket have transacted quickly, many other less notable homes have languished on the market.
Click here to view the complete report for a neighborhood by neighborhood breakdown of Average Sale Price, size, and number of homes sold.
CONDOS – SEATTLE & EASTSIDE
Still the only affordable option for many home buyers today, condos have continued to escalate in value with appreciation rates above those of residential homes in many areas.

On the Eastside, new condo and townhome developments in Crossroads and Rose Hill drove prices up to new highs in those communities. Richmond Beach and Shoreline benefited from an infusion of new construction standalone condominium ‘homes’ on very small lots.
Check out all of these factoids and more in the full condo report.
WATERFRONT

Several significant sales accented an otherwise unremarkable quarter. A $26.8 million iconic Medina estate on 2.5 acres with 150 feet of waterfront set a new benchmark on the Eastside. Two $8+ million homes on the north end of Mercer Island–both newer construction with over 7,000 square feet–set the tone for the Island in 2018. Lake Sammamish, with a $4.2 million sale in Q1, is still in hot demand, while Seattle saw only three modest waterfront sales.
Check out the full Waterfront Report for a complete list of waterfront home sales by address and community.
ABOUT WINDERMERE MERCER ISLAND
We earn the trust and loyalty of our brokers and clients by doing real estate exceptionally well. The leader in our market, we deliver client-focused service in an authentic, collaborative and transparent manner and with the unmatched knowledge and expertise that comes from decades of experience.
© Copyright 2018, Windermere Real Estate/Mercer Island. Information and statistics derived from Northwest Multiple Listing Service and deemed accurate but not guaranteed.v
Baby Boomers: Impact on the U.S. Housing Market
Originally posted on Windermere Blog.
75 million Baby Boomers control nearly 80% of all U.S. wealth, and as this generation ages, retires, and inevitably downsizes, they will have a significant impact on the housing market. Windermere’s Chief Economist, Matthew Gardner, explains when we can expect to see Boomers start to sell, opening much-needed inventory and making home ownership available to younger generations.
What We Know (and Don’t Know) About the Impact of Brexit
This blog post authored by Matthew Gardner originally appears on Windermere Blog on June 27, 2016.
The decision of the British public to leave the European Union is a historic one for many reasons, not least of which was the almost uniform belief that there was absolutely no way that the public would vote to dissolve a partnership that had been in existence since the UK became a member nation back in 1973. However, rightly or not, the people decided that it was time to leave.
As both an economist, and native of the UK, I’ve been bombarded with questions from people about what impact Brexit will have on the global economy and U.S. housing market. I’ll start with the economy.
Since last Thursday’s announcement, there have been exceptional ripples around the global economy that were felt here in the U.S. too. This isn’t all that surprising given that the vast majority of us believed that the UK would vote to remain in the EU; however, I believe things will start to settle down as soon as the smoke clears. The only problem is that the smoke remains remarkably dense.
The British government does not appear to be in any hurry to invoke Article 50 of the Lisbon Treaty, which allows a member country to leave the conglomerate. Additionally, nobody appears able to provide any definitive data as to what the effect of the UK leaving will really have on the European or global economies.
As a result, you have those who suggest that it will lead to a “modest” recession in the UK, as well as extremists who are forecasting a return of the 4-horsemen of the apocalypse. But in reality, no one really knows, and it is that type of uncertainty that feeds on itself and can cause wild fluctuations in the market.
It’s important to understand that last Thursday’s vote does not confirm an actual exit from the European Union. There is a prolonged process of leaving that is set out in the EU Treaty which requires a “cooling off” period. And during this time, even confident political leaders, such as Boris Johnson who championed the exit campaign, might be tempted by reforms that would see Great Britain actually remaining in the EU.
The EU itself has been shaken by the vote, and there are already signs that many of its leaders are talking about moving away from the Federal structure of the Union in favor of a looser, intergovernmental agreement, that would allow greater sovereignty for its member states.
This is clearly an obvious attempt to accommodate what is already a groundswell of opposition to the Union that is much wider than just Britain, and now includes France, Spain, Greece and Portugal, all of whom are considering their own exits.
So what does this mean for the U.S.?
As far as any direct impact of the Brexit on the U.S. economy is concerned, I foresee a continued period of volatility given the aforementioned uncertainty. That said, any predictable effects on the U.S. will be limited to a “headwind” to growth, but not enough to drive us into a recession. Our financial system is solid and U.S. exposure to European debt is still limited. I wouldn’t be surprised to see a slowdown in U.S. exports as the dollar continues to gain strength against European currencies, but those effects will be fairly modest.
As for the impact on housing, U.S. real estate markets could actually benefit. Uncertain economic times almost always lead to a “flight to safety”, which means global capital could pour into the United States bond market at an aggressive rate. With this capital injection, the interest rate on bonds would be driven down, resulting in a drop on mortgage rates. And a drop in mortgage rates makes it cheaper to borrow money to buy a home.
On the flip side, one thing that concerns me about lower interest rates is that it could draw more buyers into the market, compounding already competitive conditions, and driving up home prices. And housing affordability would inevitably take yet another hit.
Let’s not fool ourselves; what we’re seeing is a divorce between the UK and a majority of Europe. And like most divorces, there are no good decisions that will make everybody happy. We need to be prepared for the fact that it is going to be a very ugly, nasty, brutal, lawyer-riddled, expensive divorce.
My biggest concern for the U.S. is that the Federal Reserve must now pause in its desire to raise interest rates (I now believe that we will not see another increase this year as a result of Brexit). This is troubling because we need to normalize rates in preparation for a recession that is surely on the way in the next couple of years. The longer we put that off, the less prepared we will be when our economy eventually turns down.
 Matthew Gardner is the Chief Economist for Windermere Real Estate, specializing in residential market analysis, commercial/industrial market analysis, financial analysis, and land use and regional economics. He is the former Principal of Gardner Economics, and has over 25 years of professional experience both in the U.S. and U.K.

Rising Interest Rates Spur Buyer Competition
According to a recent report by the Northwest Multiple Listing Service, well-priced homes are drawing multiple offers, with jumps in both pending and closed home sales compared to this time last year. While the number of new listings is also up, the overall inventory of available homes is still low compared to buyer demand…and with interest rates starting to climb, the competition among buyers has reached a fever pitch.
Click here for the full article and a county-by-county statistical summary!

May Reports Show Home Prices Up
New listings in the month of May lowered absorption rates slightly in Seattle, the Eastside and King County while pending sales remained strong. Mercer Island saw a decent decline in pending sales…likely due, in part, to the lack of inventory for sale in key price ranges. Median sales prices are up in most areas and average sales prices are varied. By far, the strongest spring market we have seen in years.

Data prepared and analyzed by Julie Nugent for Windermere Real Estate/Mercer Island. For questions or comments, email Julie at julie@windermere.com.
Pending Sales Soar in Greater Seattle
The absorption rate based on pending home sales continues to be off the charts with listing inventory very low and sales activity brisk. Overall, prices have continued to slip slightly in all areas except Seattle Metro–which actually saw prices rise. Of note however, is the fact that distressed properties have sold for significantly less than non-distressed homes for sale.

Data prepared and analyzed by Julie Nugent for Windermere Real Estate/Mercer Island. For questions or comments, email Julie at julie@windermere.com.

